
In the latest update on Uniswap (UNI), we’ll delve into its recent price movements, chart patterns, and potential breakout targets. As previously discussed, Uniswap has been exhibiting some fascinating chart formations that traders are closely watching. In this analysis, we’ll explore Uniswap’s breakout from a long-term downtrend and its current behavior within a new falling wedge pattern.
Uniswap’s Breakout from the Long-Term Down Channel
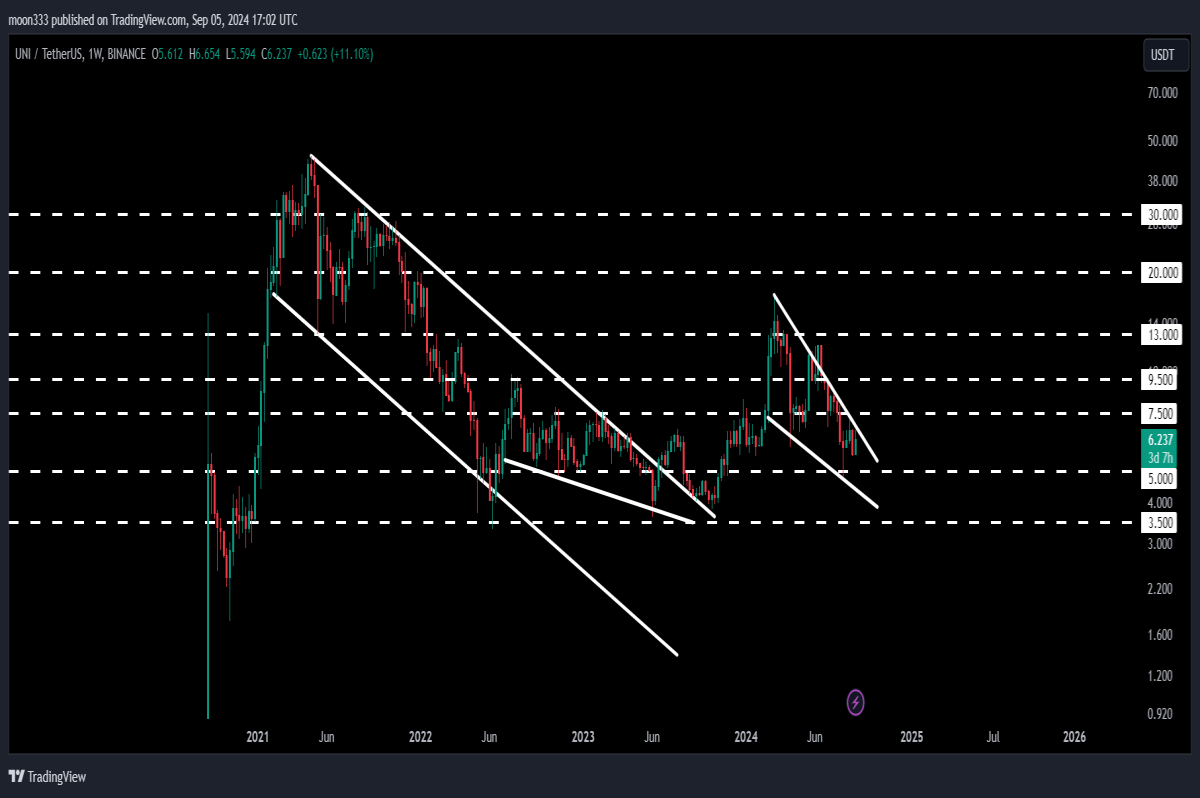
Looking back at Uniswap’s breakout from a down channel on the weekly time frame, we witnessed a significant rally. This breakout propelled the price upward, surpassing the expected technical target at $9.55. In fact, Uniswap surged by an impressive 344%, far exceeding the initial expectations. However, after this surge, the price got stuck in another technical pattern—this time, a falling wedge.
Current Price Action: The Formation of a Falling Wedge
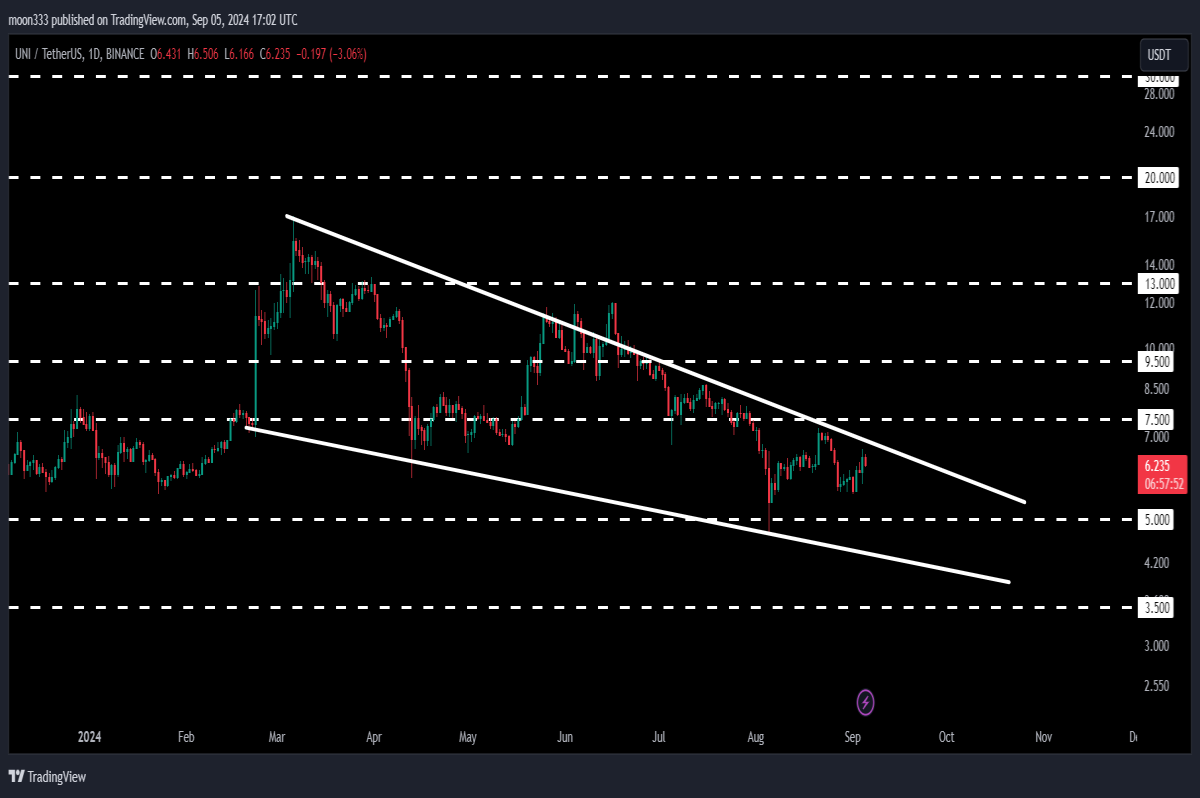
On the daily time frame, Uniswap has been trading within a falling wedge pattern. This pattern has been forming for the past several weeks, starting from the 2nd of September 2024. The price has been consistently rejected at the wedge’s resistance while bouncing off the support. Notably, a fake breakout occurred during this period, but Uniswap quickly re-entered the wedge.
As the price continues to move within this pattern, it is currently heading toward the wedge’s support. However, an important long-term support level exists around the $5 mark, which traders are monitoring closely. If this level breaks down, Uniswap may test the lower support of the wedge, which lies near $4.30.
Potential Breakout Scenarios
Despite the challenges Uniswap has faced, the falling wedge is generally considered a bullish pattern. This indicates that, sooner or later, a breakout could occur. If Uniswap manages to break out of the wedge, the next major hurdle would be the resistance at $7.50. Historically, this level has acted as strong resistance and support, making it a key area to watch.
On the weekly time frame, the $7.50 level has served as resistance multiple times in the past and is likely to do so again. Therefore, even if Uniswap breaks out of the wedge, traders should anticipate resistance at this level.
Key Levels to Watch: Targets and Resistance Zones
If Uniswap successfully breaks out of the wedge, the technical target for this pattern is expected to be around $17. A move to this level would also mean testing the significant resistance at $13, a level that has historically provided strong support before flipping into resistance.
Looking ahead, Uniswap’s ultimate target from the earlier down channel breakout is between $45 to $50. However, for this long-term target to be in play, Uniswap will need to clear several resistance levels and maintain upward momentum.
Conclusion: Uniswap’s Next Move
Uniswap’s price movements within the falling wedge pattern suggest potential for a bullish breakout. However, with resistance at $7.50 and $13, traders should keep a close eye on the price action at these critical levels. If the price does break out, a rally towards $17 or even higher could be possible, ultimately setting the stage for Uniswap to target the $45-$50 range.
For those interested in trading signals, you can support the channel as a YouTube member or Patreon member, where detailed signals are shared regularly.


