
Introduction
Hello everyone! I hope you're doing well. In this article, we'll be taking a detailed look at TRX's recent price action and its potential future movements. Previously, I highlighted that TRX had dropped to the support of a long-term up-channel, and now it has bounced back strongly from this level. Let's dive into the analysis of this move and also discuss a significant breakout on the weekly chart from a large descending triangle.
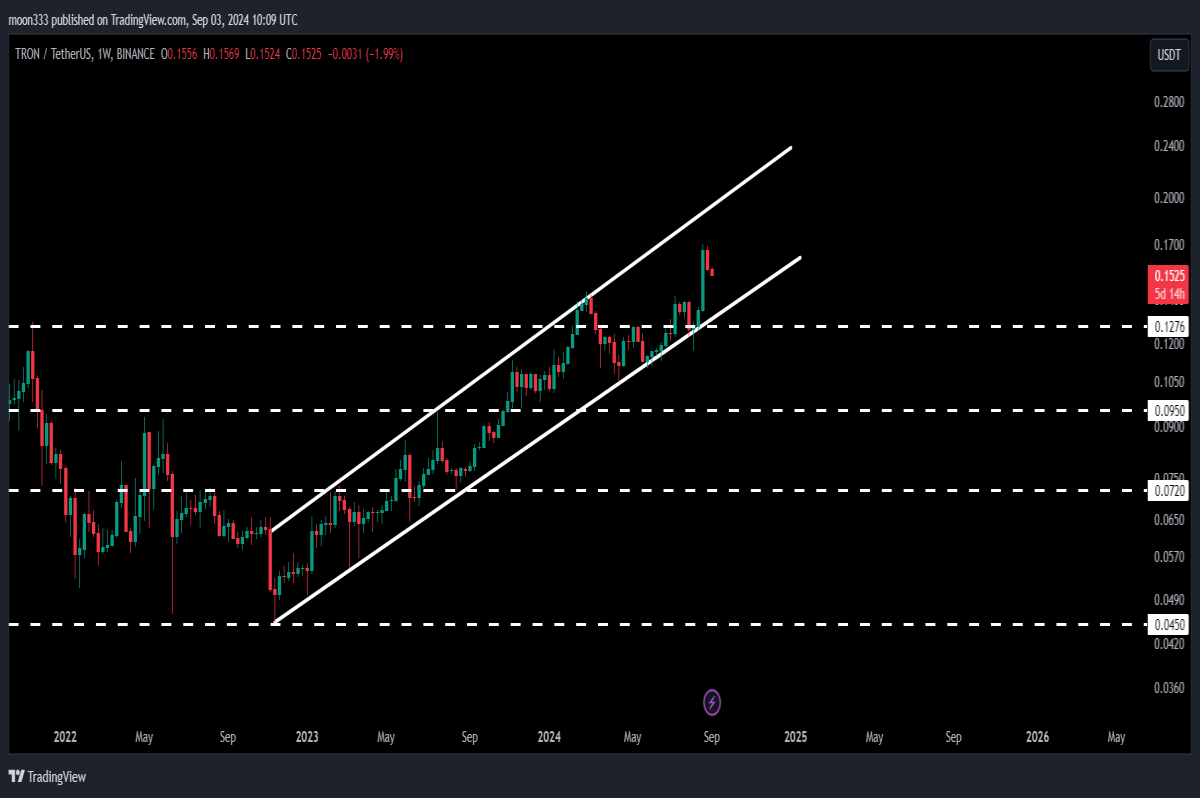
TRX’s Recent Bounce from Channel Support
On the 7-day timeframe, TRX has shown resilience by bouncing off the support of its long-term up-channel. The price is now making its way towards the channel's resistance. This upward movement is a positive sign, suggesting that TRX may continue its upward trajectory in the coming weeks.
Massive Breakout from the Descending Triangle
Another crucial development is the breakout from a large descending triangle on the weekly chart. This pattern, which had been forming over a long period, finally saw a bullish breakout, adding further momentum to TRX's upward movement.

Recent Trade Signal: 44% Pump
On July 22nd, 2024, I shared a trade signal for TRX, which was based on a harmonic bullish reversal Cypher pattern against Bitcoin on the daily chart. This trade has been highly successful, producing a 44% pump so far. The price initiated a strong reversal from the designated buying zone, hit the sell targets, and continued to climb, showcasing the effectiveness of harmonic patterns in predicting price movements.

Click here to visit this trade signal
Current Price Action: Testing Resistance Levels
Moving on to the live chart of TRX, we see that the price has been following the up-channel since November 2022. This channel has provided multiple opportunities for bounces and rejections as TRX navigates its way upward. Recently, the price tested the critical support at 12.76 cents, which had previously acted as a strong resistance. After confirming this level as support, TRX surged higher and is now approaching the channel's resistance, currently around 19 cents.
Future Targets: 25-30 Cents Range
The breakout from the descending triangle has set a technical target of approximately 24 to 25 cents. With the current price movement, TRX is on track to reach this target soon. If TRX manages to break out above the current up-channel, the next target could be in the range of 28 to 30 cents.
Conclusion
In conclusion, TRX has demonstrated strong bullish behavior with a recent bounce from the up-channel support and a significant breakout from a descending triangle. The short-term target is 24 to 25 cents, and a breakout from the current channel could push TRX even higher to the 28 to 30 cents range.
If you enjoyed this analysis, don't forget to like and follow the blog. For more trading signals and updates, consider joining me as a YouTube member or Patreon supporter. Links to join are as below:


