
Introduction
Hello, friends! I hope you're doing well. In today's update, we’ll dive into the recent developments on TFUEL. In previous videos, I discussed how TFUEL had broken out of a large falling wedge pattern on a 7-day timeframe chart. Following that, the price became trapped inside a downward channel on the daily chart. Now, let's analyze the recent movements and examine what might come next for TFUEL.
Overview of TFUEL’s Weekly Chart
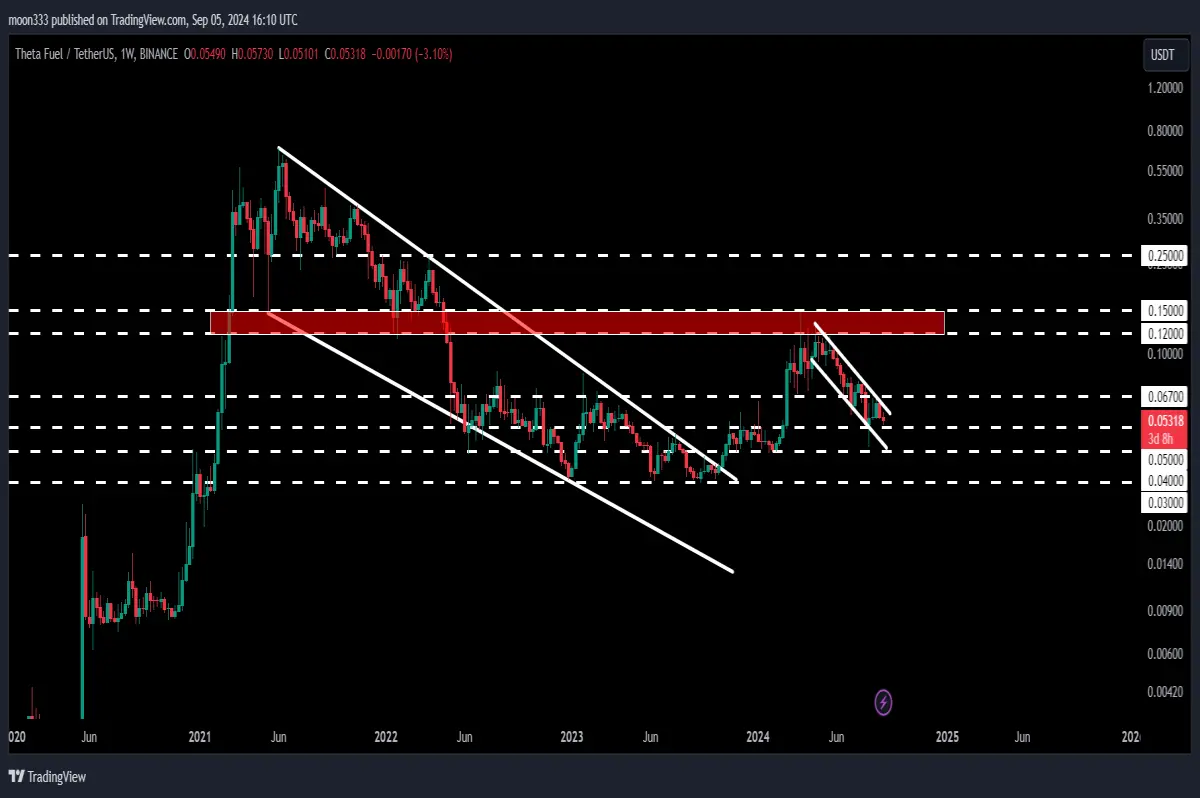
Starting with the weekly timeframe chart, you can see that TFUEL had previously broken out of a massive falling wedge pattern. After this breakout, the price entered a downward channel on the daily chart. Recently, on August 24, 2024, TFUEL faced a rejection at the resistance of this channel and also at a significant long-term resistance level of 6.7 cents.
Rejection and Support Levels
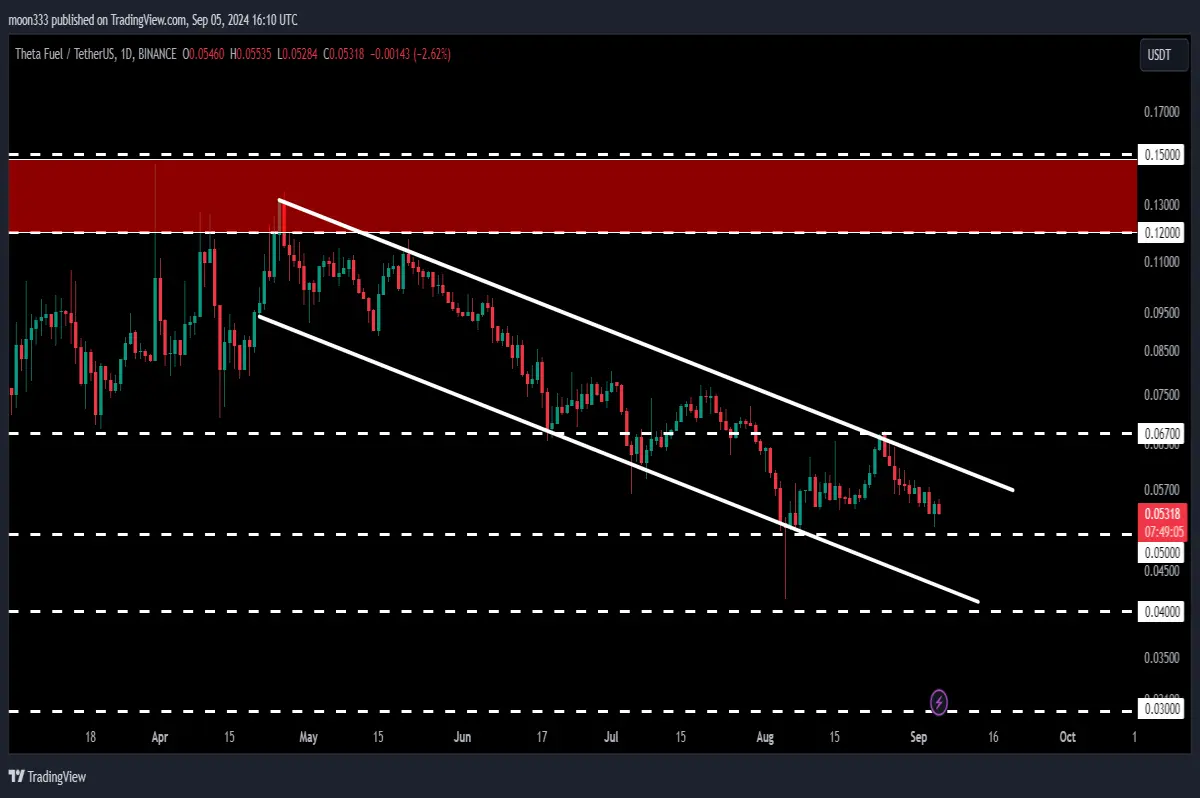
In the past few days, TFUEL’s price has remained inside this channel. There was a long wick to the downside, but it did not break the channel's support or the 5-cent level, which is another important support zone. The price briefly touched close to the next support level at 4 cents but quickly bounced back. Currently, TFUEL faces resistance both from the channel and the 6.5 to 6.7 cents range.
Key Resistance and Potential Breakout
When we analyze the 7-day chart, the 6.7-cent level has been a key resistance for several weeks, acting as both support and resistance in the past. If TFUEL manages to break out of the downward channel, it could potentially target the long-term resistance between 12 to 15 cents. This zone was previously a strong support but has now become a resistance area.
The technical target for a successful breakout from this channel is 12 cents. However, for TFUEL to continue its upward momentum after breaking out of the wedge, it will need to surpass this significant 12 to 15-cent resistance zone.
Long-Term Target
Looking at the bigger picture, the long-term target for TFUEL after the breakout from the falling wedge pattern is approximately 70 cents, which is at the top of the wedge formation.
Conclusion
This was the latest update on TFUEL’s price movements and potential future targets. If you enjoyed the analysis, don’t forget to like the article and follow the blog for more updates. For more trading signals, consider joining my YouTube or Patreon membership, where I share detailed trade setups.





