
On Nov 1st 2019 I published the idea of Tezos / US Dollar on tradingview and on my youtube channel where the price action formed bullish Gartley which produced more than 121% profit and below was the idea:
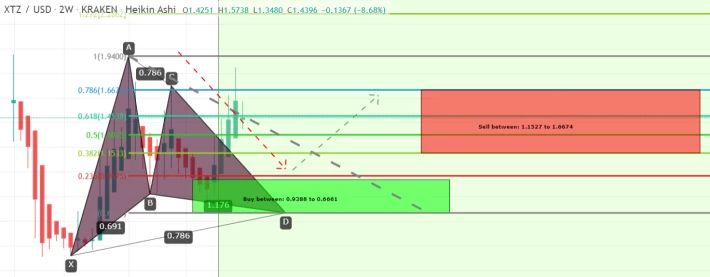
Now the price action of World's 10th ranked largest cryptocurrency out of more than 2300 cryptocurrencies Tezos (XTZ) has formed bullish Cypher pattern and entered in potential reversal zone and ready to take bullish reversal soon at any time.
This potential reversal zone should be used as stop loss in case of complete candle stick closes below this zone.
Lets have a look on the dimensions of Tezos (XTZ) price action's harmonic move:
After initial leg (X to A) the A to B leg is retraced between 0.382 to 0.618 Fibonacci (The exact measuring is 0.446 Fibonacci) and then B to C leg is projected between 1.272 to 1.414 of A to X leg's Fibonacci projection (The exact projection is 1.333 Fibonacci) and final (C to D) leg is retraced between 0.618 to 0.786 Fibonacci projection of X to D leg as required for perfect bullish Cypher and now the price action is entered in potential reversal zone of this bullish Cypher pattern, now we can expect bullish move at any time which will lead the priceline between 0.382 to 0.786 Fibonacci projection of C to D leg, but after this bullish divergence if the candles sticks will be closed above 0.786 Fibonacci levels then it can also lead to the long term bullish move.
As per Fibonacci sequence method we can set our targets as below for mid term trade:
Buy between: $1.3655 to $1.2356
Sell between: $1.4677 to $1.7140
So this 12hr short term chart has potential to give upto 38.5% gains.
Regards,
Atif Akbar (moon333)
The harmonic moves analysis involves hours of hard work and determination however the success of harmonic trading in fiat and cryptocurrencies is around 80% therefore it is always important that you follow any stop loss strategy while trading harmonic patterns I have also shared a stop loss idea in this article, the information in this article is for educational purpose only this is not intended to be investment advice, I have tried my best to catch the harmonic moves as per predefined classical harmonic bullish Cypher pattern if you find any flaw or you have any suggestion feel free to share with me in comments section.






