
Introduction
In this update, we’ll explore the latest developments in the Oasis Network (ROSE) price action. Oasis has recently navigated significant technical patterns, including a breakout from a large descending triangle and a consolidation within a falling wedge pattern. We’ll examine these movements, key resistance levels, and potential future targets.
Breakout from the Descending Triangle
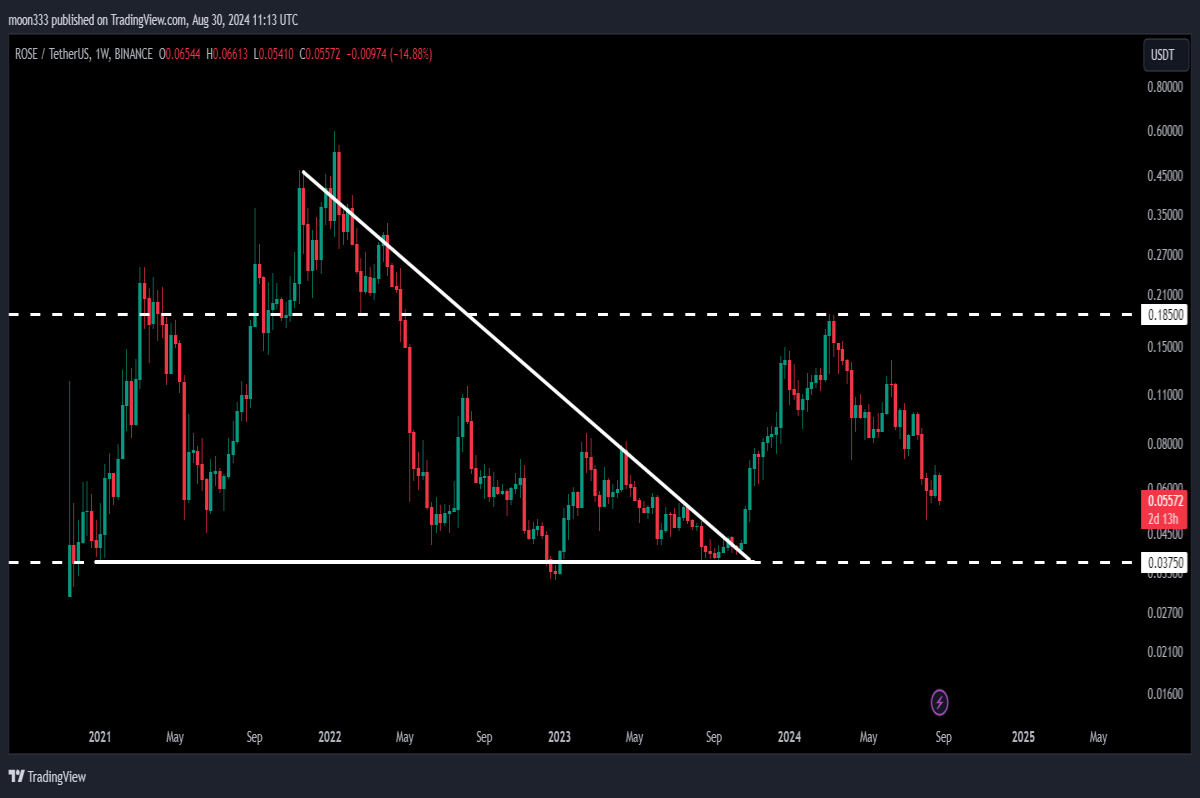
Previously, Oasis Network successfully broke out of a massive descending triangle pattern on the 7-day time frame chart. This breakout led to a notable rally, with a price increase of approximately 398%. However, the price struggled to surpass a long-term resistance level of $0.185, which had previously acted as support but has now flipped to resistance.
Current Falling Wedge Pattern
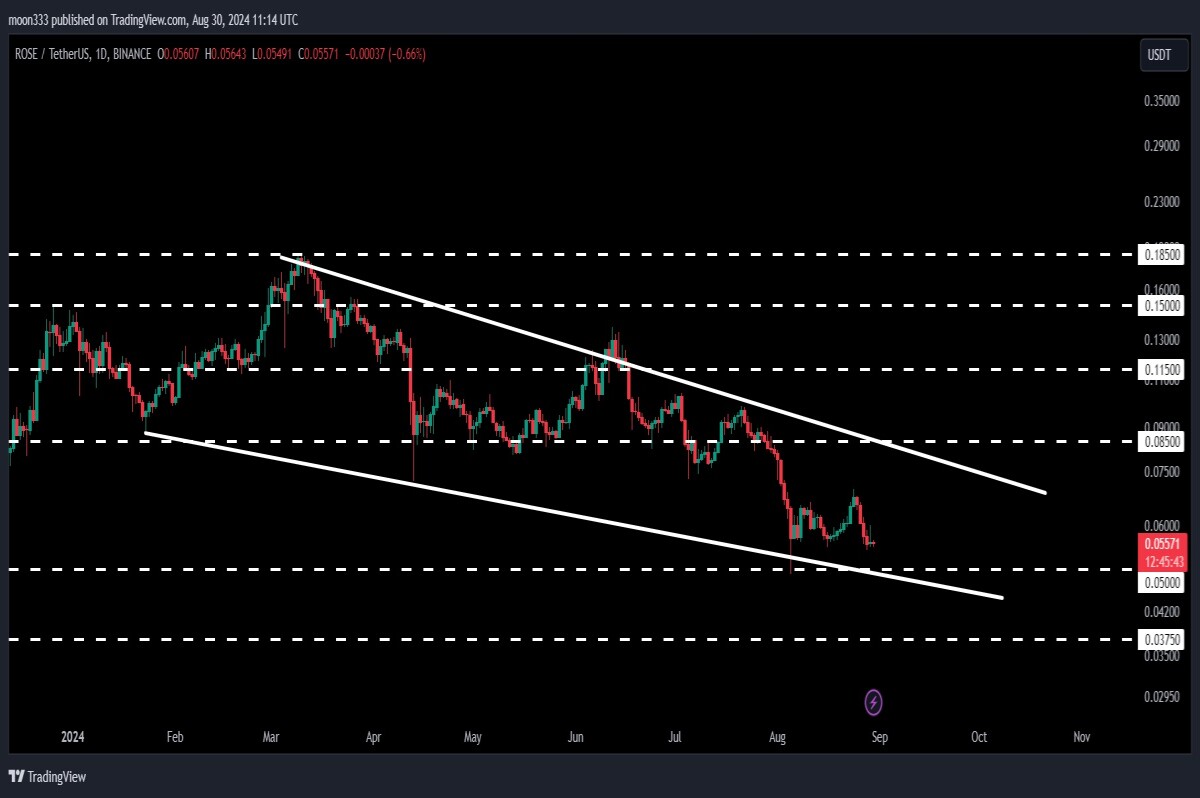
Following the breakout from the descending triangle, ROSE entered another falling wedge pattern. This pattern, while not a bull flag due to its deep retracement beyond 78%, still presents a bullish bias. On the daily time frame chart, this falling wedge is more apparent, and the price has been consolidating within this pattern since January 23, 2024.
Resistance Levels and Technical Targets
- Short-Term Resistance: The current resistance of the falling wedge is around $0.076. Just above this, another significant resistance is at $0.085. Historically, this level has acted as strong support and resistance, adding to its importance.
- Long-Term Resistance: The $0.185 level remains a crucial resistance. For ROSE to continue its bullish momentum, it needs to break through this level.
- Potential Targets: If ROSE breaks out of the falling wedge, the immediate technical target will be again around $0.185. Additionally, the target for the breakout from the larger descending triangle remains, projected between $0.50 and $0.55.
Conclusion
Oasis Network is at a critical juncture, having recently navigated a significant breakout and now consolidating within a new pattern. Key resistance levels at $0.076 and $0.085, as well as the more substantial $0.185 level, will be crucial for determining the next price movement. A successful breakout above these levels could pave the way for reaching the higher targets of $0.50 to $0.55.
For ongoing analysis and trading signals, consider subscribing to the channel or joining as a YouTube or Patreon member. Stay informed and make the most of your trading strategies with timely updates and insights.


