
Hey friends, hope you are well, and welcome to the latest update on SushiSwap. In this article, we will analyze the recent price action within a falling wedge pattern and discuss the implications of a recent breakout observed on the 7-day timeframe chart.
Current Price Action: The Falling Wedge Pattern
For the past several days, the price of SushiSwap has been consistently moving within a falling wedge pattern. This pattern indicates that the price movement is getting squeezed, and as of now, it has once again approached the resistance of the wedge.
The falling wedge pattern is typically a bullish signal, suggesting that a breakout could occur. However, we must remain cautious as the price is currently at a crucial resistance level.
Recent Breakout and Price Dynamics
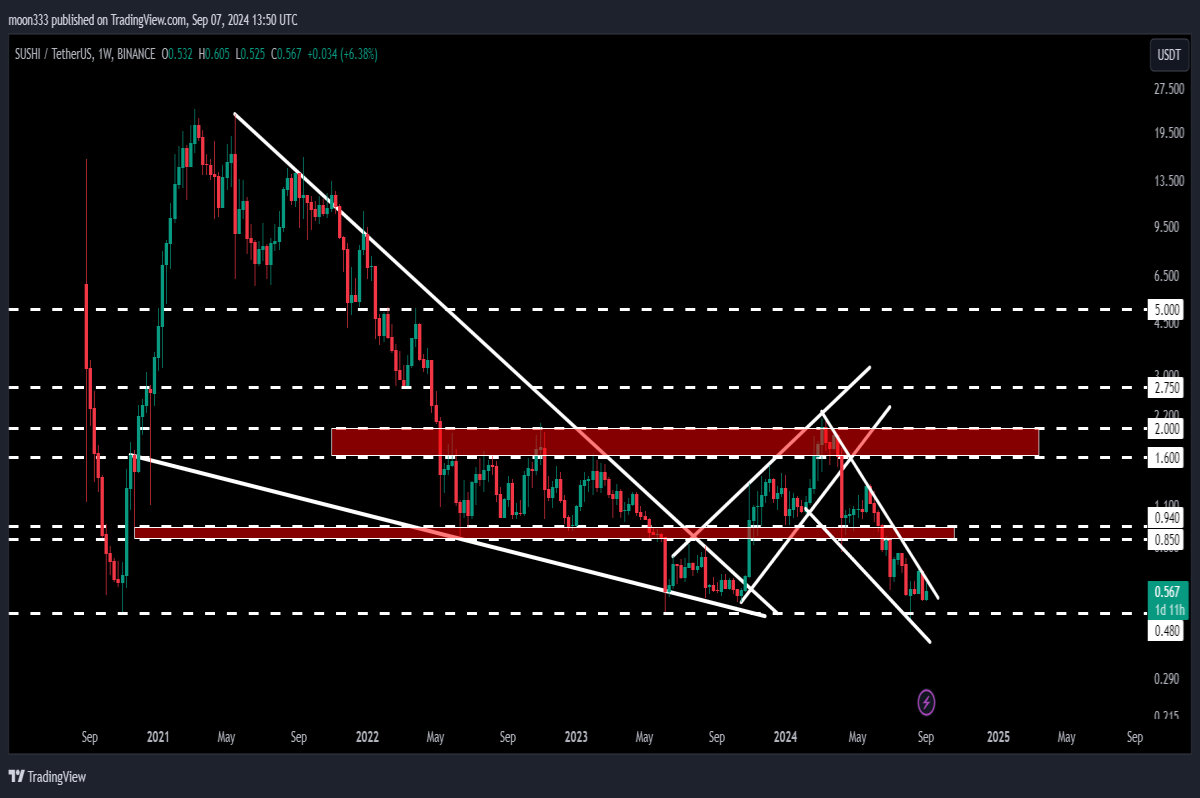
On the 7-day timeframe chart, we observed a significant breakout from a larger, long-term falling wedge pattern. Following this breakout, the price formed a rising wedge pattern, which generally indicates bearish behavior. Although the price surged approximately 346% after the initial breakout, it struggled to break through a long-term resistance zone ranging from $1.60 to $2.00.
Eventually, the price broke down from the rising wedge pattern, leading to a technical target for this breakdown at approximately $0.48. This level coincides with a long-term support area, and the price has recently bounced from this support.
Key Support and Resistance Levels
Looking at the daily timeframe chart, we can see that since May 5, 2024, the price has been oscillating within the falling wedge pattern. Notably, the price recently broke down a significant resistance zone that extends from $0.85 to $0.95. This area had previously acted as strong support for several months before flipping to resistance after the breakdown.
Additionally, a head and shoulders pattern formed during this timeframe, with the support zone at $0.85 to $0.94 acting as the neckline. After breaking down from this pattern, the price experienced a notable drop.
Potential Outcomes: Breakout or Breakdown?
Currently, the price is squeezed between the support and resistance of the falling wedge pattern. If the price gets rejected at the upper resistance, it could test the support at $0.48. If this support fails, the next target could be around $0.38.
However, should the price break out of the falling wedge pattern, the technical target for this breakout would be at the top of the wedge, approximately $2.24. If the price reaches this level, it could potentially break the long-term resistance zone ranging from $1.60 to $2.00.
Long-Term Targets and Resistance Levels
On the weekly timeframe, we can observe that the resistance zone starting from $1.60 to $2.00 has been a significant barrier for the price. To continue the upward trend established after breaking out of the massive falling wedge pattern in October 2023, the price must overcome this resistance zone.
If successful, the long-term technical target for a breakout from the larger falling wedge pattern would be approximately $25. This target highlights the potential for significant price appreciation should the market conditions align favorably.
Conclusion
In summary, SushiSwap's price action is currently constrained within a falling wedge pattern, with critical support and resistance levels in play. While a breakout appears to be a favorable scenario, the price must navigate past several obstacles before confirming a bullish trend.
Thank you for reading! If you found this analysis helpful, please hit the like button and subscribe to the channel for more updates. For additional trading signals, consider joining me on YouTube or Patreon, where I share various trading insights. You can find the link to join in the video description.
Take care, and goodbye!


