
Introduction
In this analysis, we will take a closer look at LTO Network (LTO) and its recent price movements. After breaking out of a massive falling wedge pattern on the weekly time frame, LTO experienced a significant rally. However, the price has encountered some key resistance levels. We'll explore the implications of these movements and what they might mean for LTO's future price action.
The Massive Falling Wedge Breakout
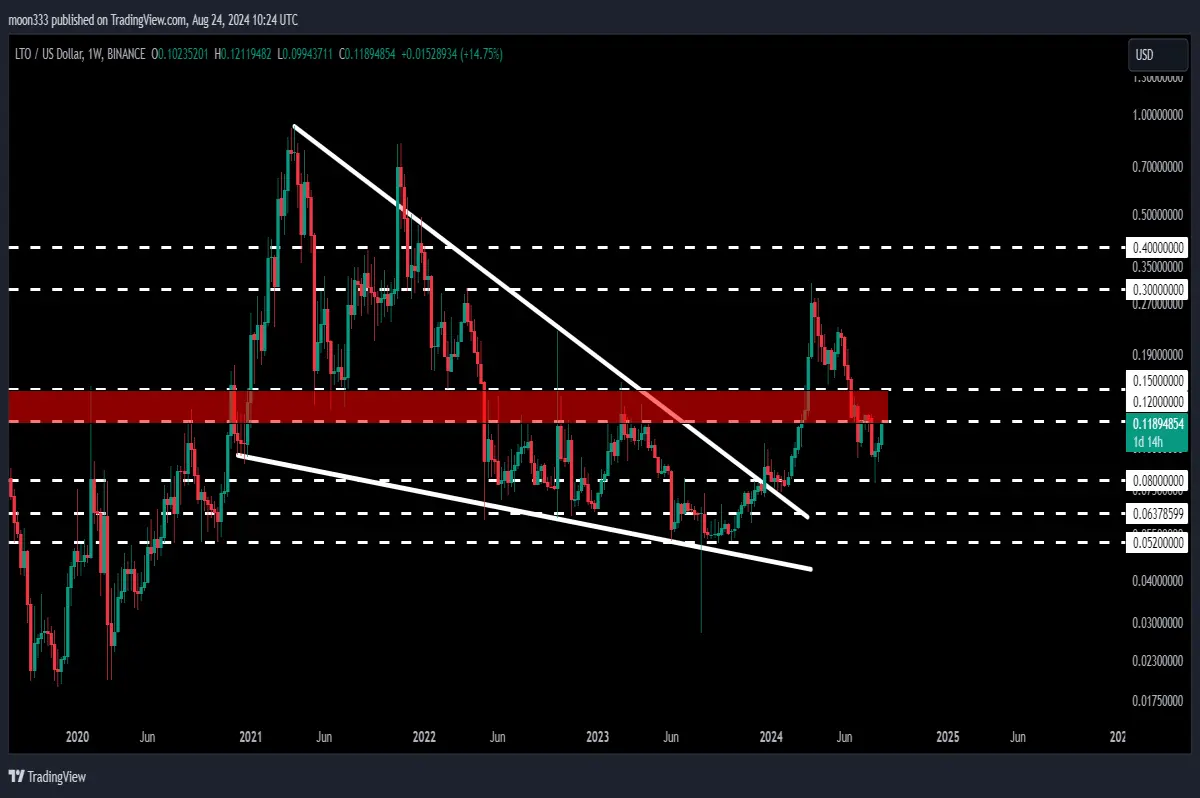
LTO had been trading within a large falling wedge pattern since December 2020. This pattern continued for nearly two years, with the price being squeezed between the pattern's support and resistance lines. In November 2021, there was a brief fake-out, but the price quickly re-entered the wedge. Finally, LTO managed to break out of this pattern, leading to a substantial rally.
For detailed analysis, you can watch the below video:
Post-Breakout Rally and Resistance Levels
After the breakout from the falling wedge, LTO experienced an impressive rally, with the price surging by over 481% from its low to high points. However, this rally was halted by a long-term resistance level at 30 cents, a level that had previously acted as resistance in the past.
Testing the 8-Cent Support Level
Recently, LTO tested its long-term support level at 8 cents. The price managed to bounce back from this level, but it is now facing a critical resistance zone between 12 cents and 15 cents. This zone has been a significant area of both support and resistance in the past. The price is currently struggling to break through this zone, which could dictate the next major move for LTO.
Bullish Divergence and Potential Breakout
A bullish divergence has formed, with the price making a lower low while the stochastic oscillator has made a higher low. This divergence suggests that the downward momentum may be weakening, increasing the likelihood of a breakout above the current resistance zone. Additionally, there is a downtrend resistance line that LTO needs to overcome to continue its upward movement.

Long-Term Technical Target
If LTO successfully breaks out of this resistance zone, the next target would be the long-term resistance at 30 cents. Beyond that, the technical target for the breakout from the massive falling wedge pattern suggests that LTO could reach as high as 95 cents to $1 in the long term.
Conclusion
LTO is at a critical juncture, with the price currently facing significant resistance. A successful breakout could lead to substantial gains, with long-term targets pointing toward the $1 mark. Traders should keep an eye on these key levels and the potential for a continued bullish trend.






