
Introduction
Hello friends! I hope you're all well. Welcome to the latest update on Bitcoin. In this video, we'll analyze Bitcoin's recent price movements, focusing on key support levels and potential trends. As mentioned in my earlier video, Bitcoin has formed a double top and is now facing critical support challenges.
Key Support at $56,500
Live Chart Analysis
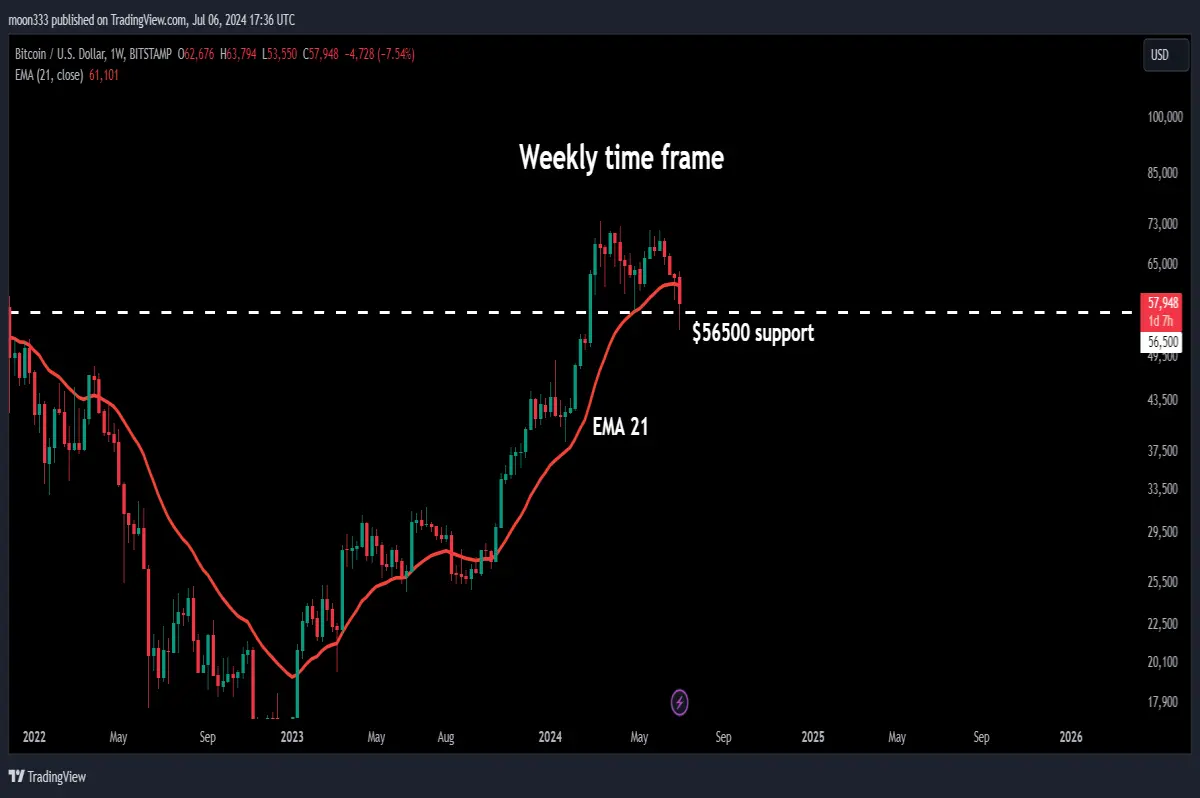
- Current Support Test: Bitcoin is currently testing the significant support level at $56,500, the lowest price of May 2024.
- Weekly Candlestick: The weekly candlestick hasn't closed below this support yet, making the weekly close crucial to watch.
- EMA 21: Bitcoin has almost broken the support of the EMA 21 on the weekly timeframe, which could lead to further declines if it closes below this level.
Historical Patterns and Recent Movements
Double Top Formation
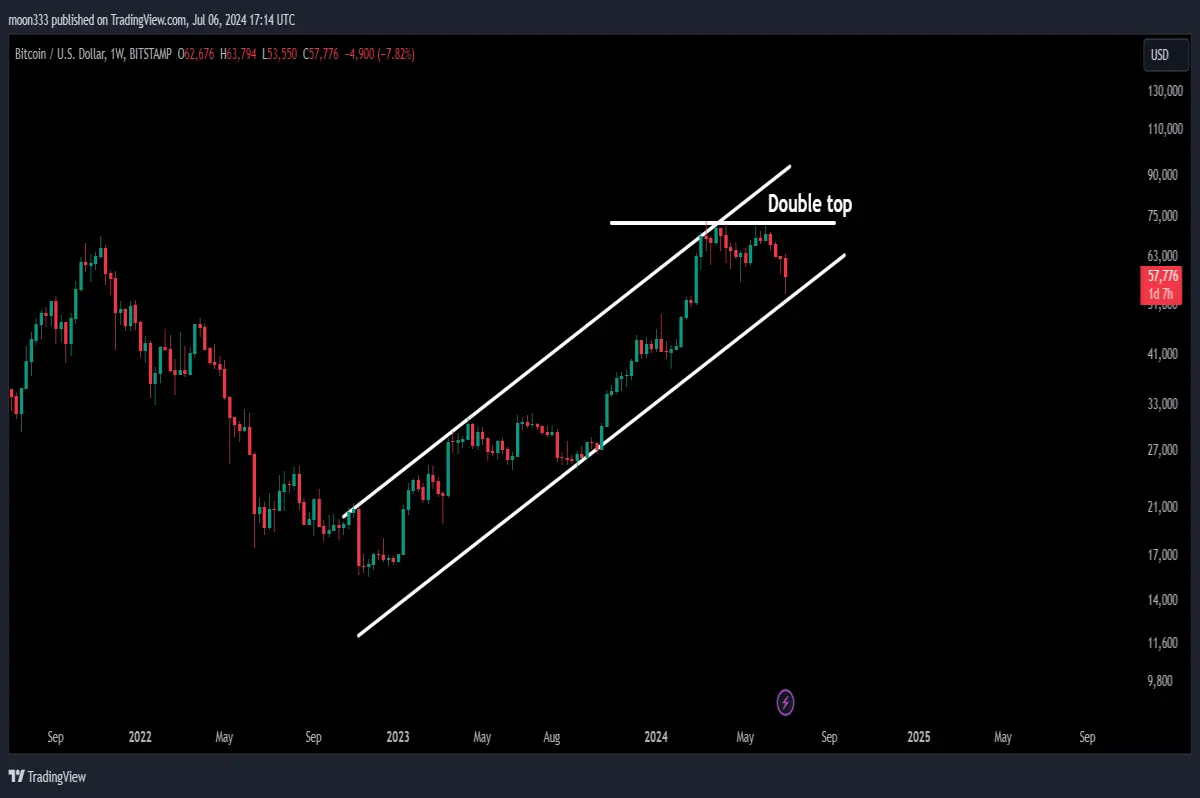
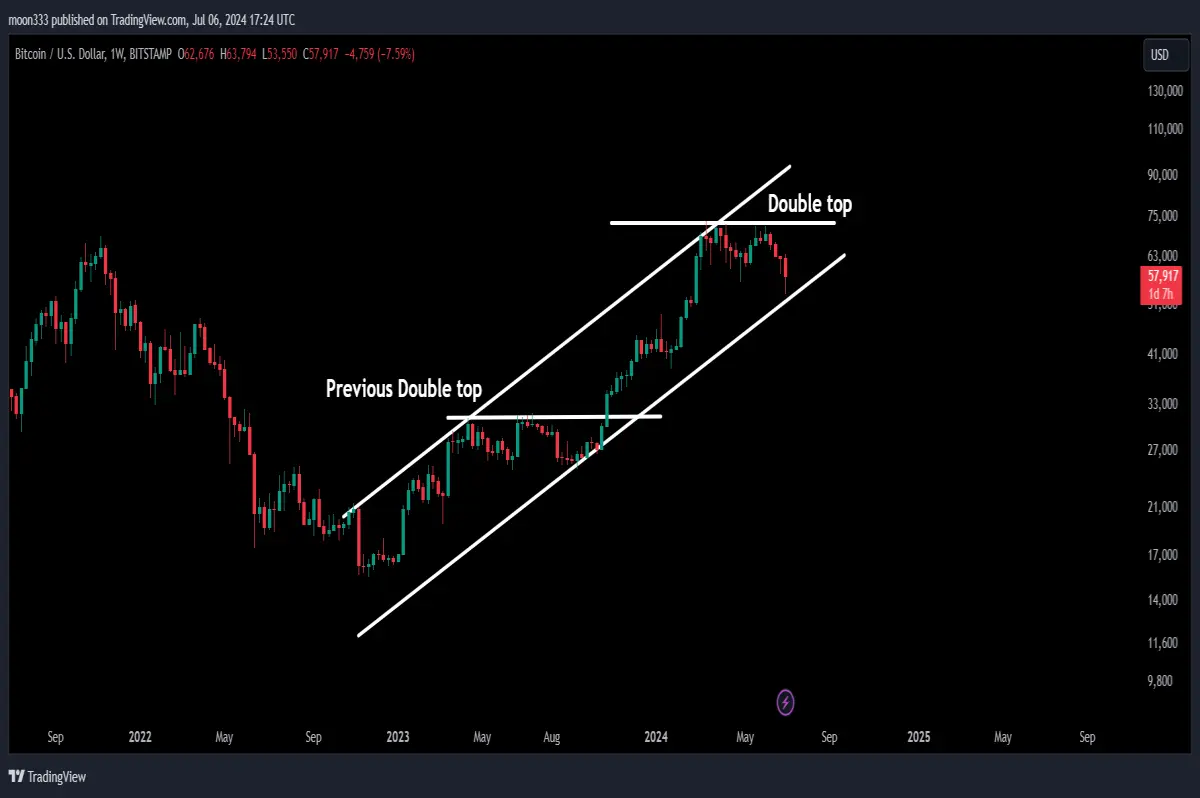
- Double Top: Bitcoin recently formed a double top around $73,000 and is moving downwards.
- Previous Double Top: A similar pattern occurred previously, but Bitcoin bounced back from the support of the channel, continuing its rally.
Falling Wedge Pattern
- Previous Breakout: Bitcoin broke out of a long-term falling wedge pattern, leading to a massive rally beyond $73,000.
- Technical Target: The breakout target was approximately $70,000, which Bitcoin surpassed.
Descending Triangle Breakdown
Daily Time Frame Chart
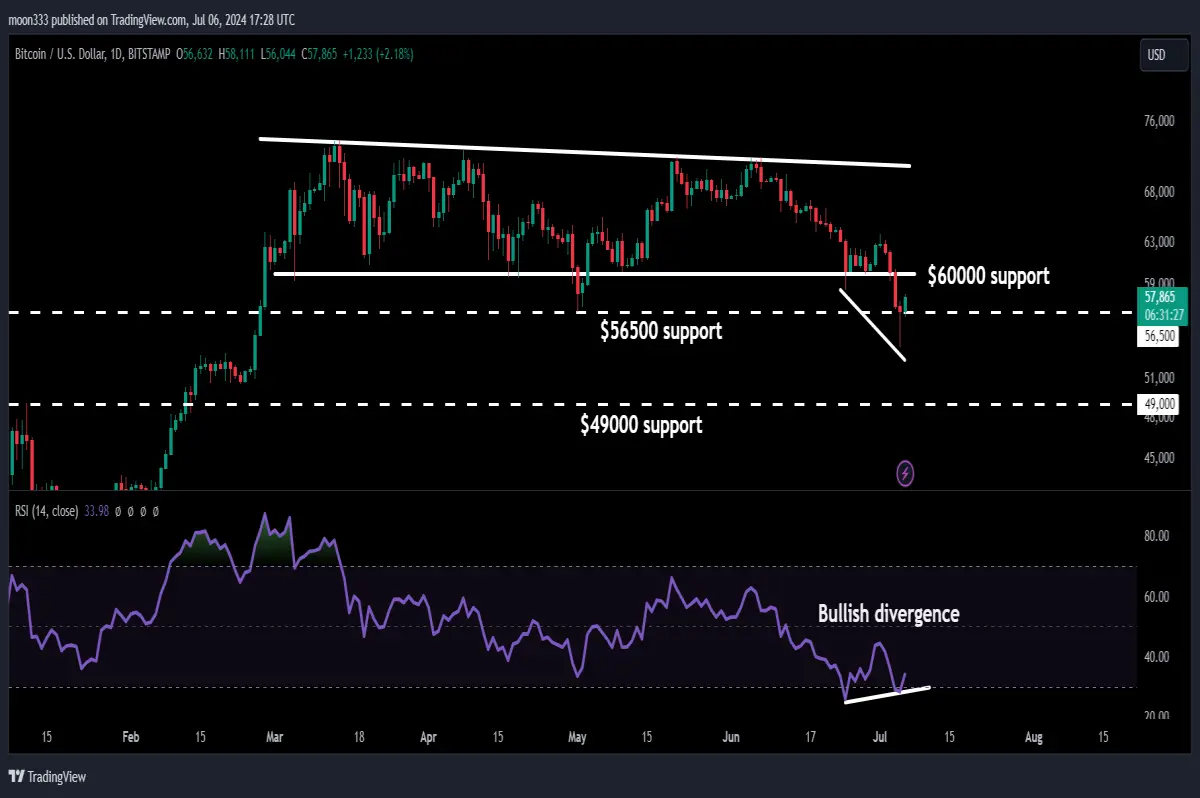
- Descending Triangle: Bitcoin has broken down from a descending triangle, with the next significant support at $56,500.
- Support Zone: The support zone ranges from $60,000 to $56,500, the lowest price of May 2024.
- Bullish Divergence: Despite the breakdown, there's a bullish divergence on the daily timeframe, with the RSI and stochastic forming higher lows while the price forms lower lows.
Potential Downside and Support Levels
Long-Term Support
- Channel Support: If Bitcoin breaks down the $56,500 support, the next major support lies at the channel support between $49,000 and $50,000.
- Historical Resistance: The $49,000 level has previously acted as resistance and support, making it a crucial level to watch.
Stochastic Analysis
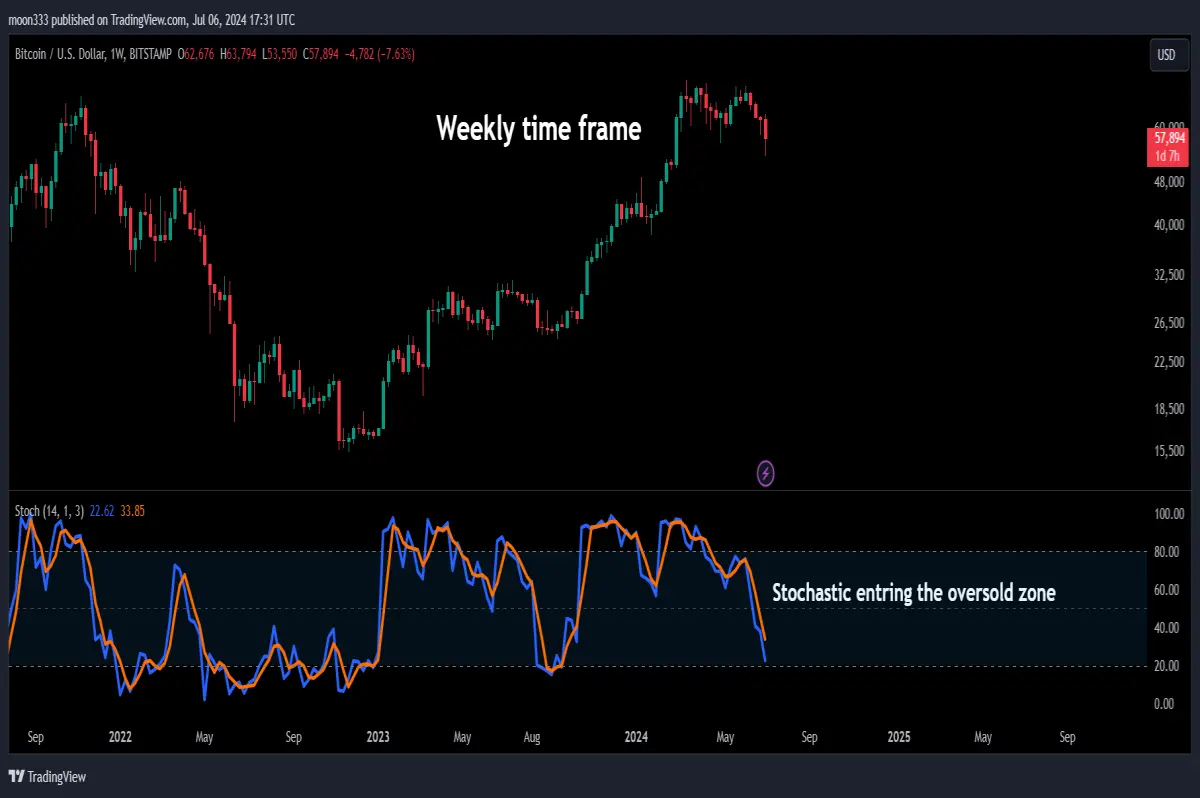
Weekly Time Frame Chart
- Oversold Condition: The fast line of the stochastic is in the oversold zone, indicating potential for stabilization.
- Crossover Watch: A crossover between the fast and slow lines of the stochastic could signal stability and a potential upward move.
Conclusion
Bitcoin is at a critical juncture, testing key support levels that will determine its next move. Monitoring the weekly close and the $56,500 support is crucial. For more detailed analyses and trading signals, consider joining as a YouTube or Patreon member. Thank you for watching, and take care!
Additional Resources
For more trading signals, you can join me as a YouTube member or a Patreon member. Links are as below:






