
About IOTA:
IOTA is ledger with distributed environment for a new economy and permission less transactions.This distributed ledger is built to power up the future of Internet of Things with cheap micro transactions and integrity of data for machines.IOTA’s distributed ledger, by contrast, does not consist of transactions grouped into blocks and stored in sequential chains, but as a stream of individual transactions entangled together.
The technical analysis of IOTA price:
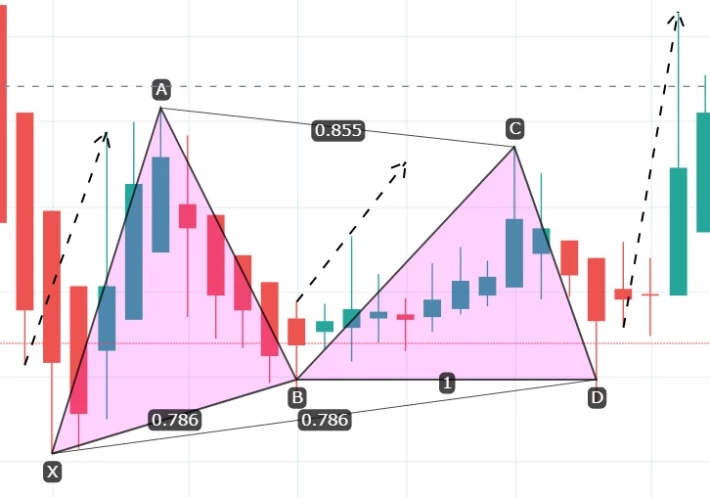
On week chart from Dec 18 to April 19 the priceline formed bullish Gartley pattern and produce more than 97% from X to A leg then more than 43% from B to C leg and again more than 97% after completion of gartley from the potential reversal zone.
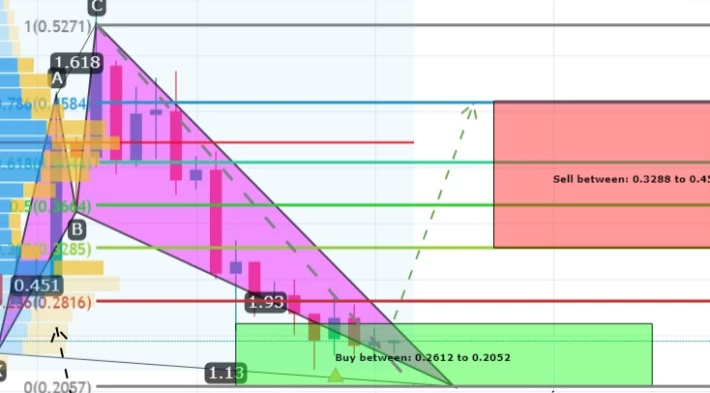
Then again on week chart the price action started the formation of bullish Shark pattern and gave more than 53% from B to C leg and now has completed the C to D leg and entered in potential reversal zone again.
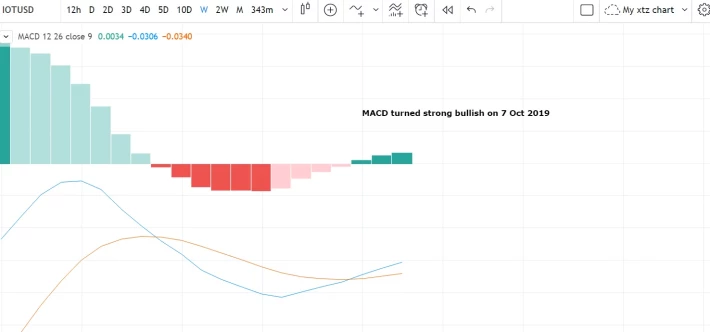
Moving Average Convergence Divergence turned strong bullish on 7 Oct 2019.
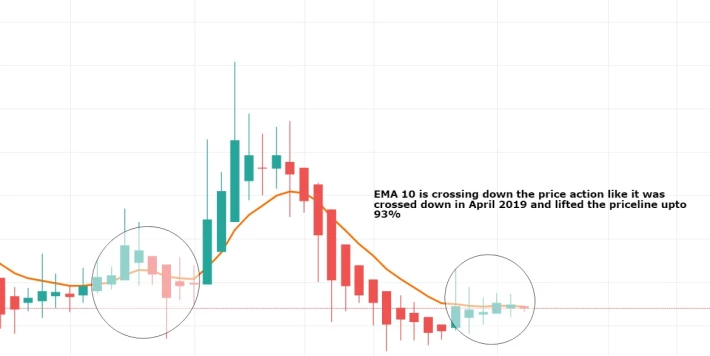
EMA 10 is crossing down the price action like it was crossed down in April 2019 and lifted the priceline upto 93%
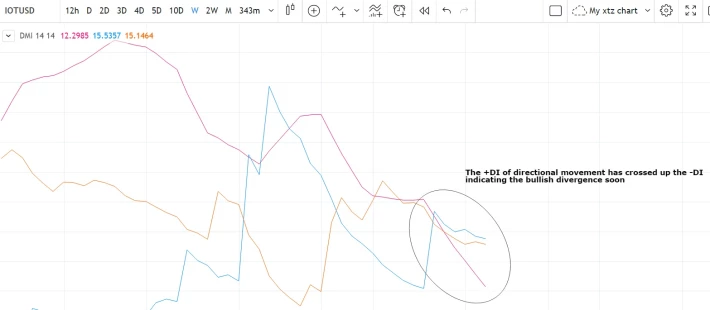
The +DI of directional movement has crossed up the -DI indicating the bullish divergence soon
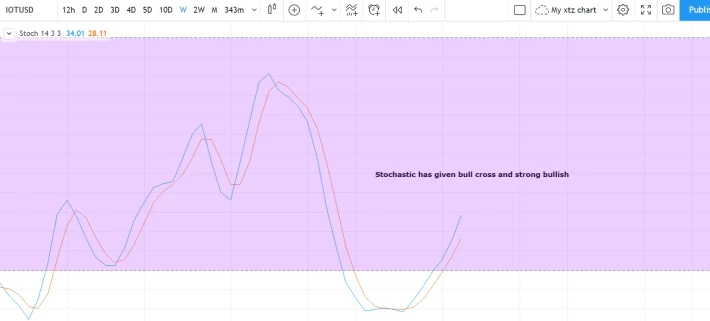
Stochastic has given bull cross and strong bullish.
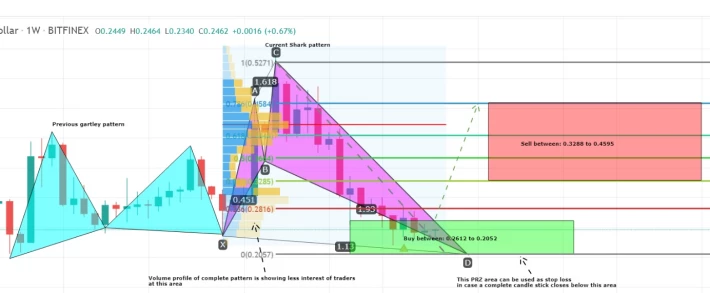
Volume profile of complete price action of Shark pattern is showing very low interest of traders at potential reversal zone level.
As per Fibonacci sequence calculation method of Shark leg the buying targets should be 0.886 to 1.13 Fibonacci of X to A leg and sell targets should be the C to D leg's fibonacci projection between 0.382 to 0.786 Fibonacci as below:
Buy between: 0.2612 to 0.2052
Sell between: 0.3288 to 0.4595
Enjoy your profits and regards,
Atif Akbar (moon333)






