
Hi Folks hope you are well and welcome to the new update on Qtum coin. This coin has a big event of Qtum Mainnet Release Qtum v0.19.1 on 28th of Aug 2020. Below is their tweet:
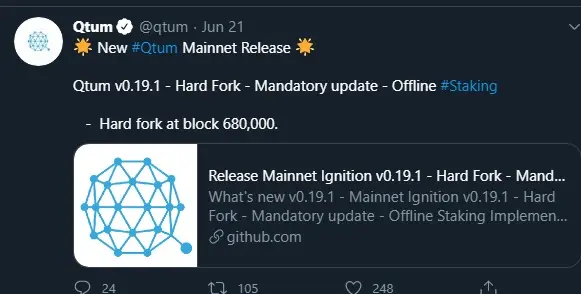
https://twitter.com/qtum/status/1274708148943826944?s=19
This is also one of the hot and trending event on coinmarketcal and on the different sites as well.
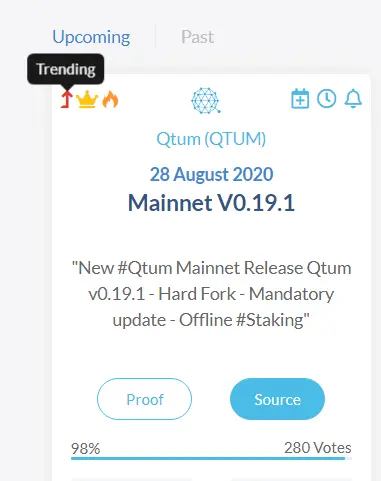
https://coinmarketcal.com/en/coin/qtum
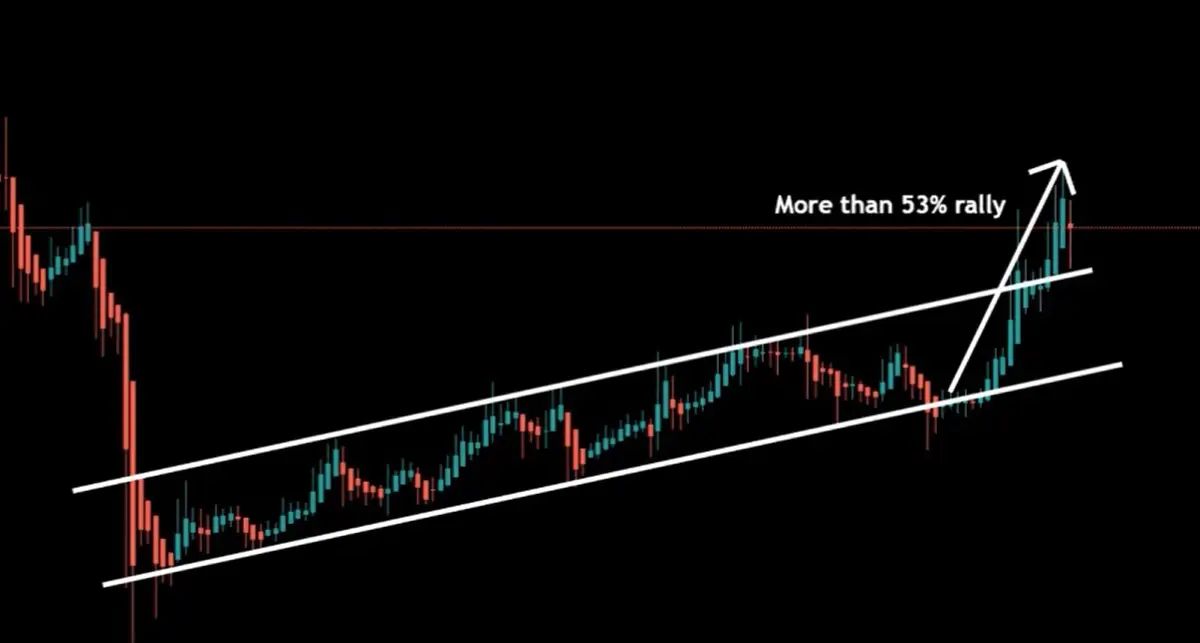
The effect of this event on priceline of Qtum coin:
If we watch the effect of this announcement on the price action of Qtum coin by moving on the live daily chart. Then it can be easily observed that the priceline was moving in an up channel and on 21 June when the announcement was added on Twitter and on the different sites then after that, the priceline of Qtum rallied more than 53% and even broke out the resistance of the channel. At this time the price line is re-testing the previous resistance of the up-channel as support. If this re-testing will be successful then we will see a more powerful bullish move than the previous one.
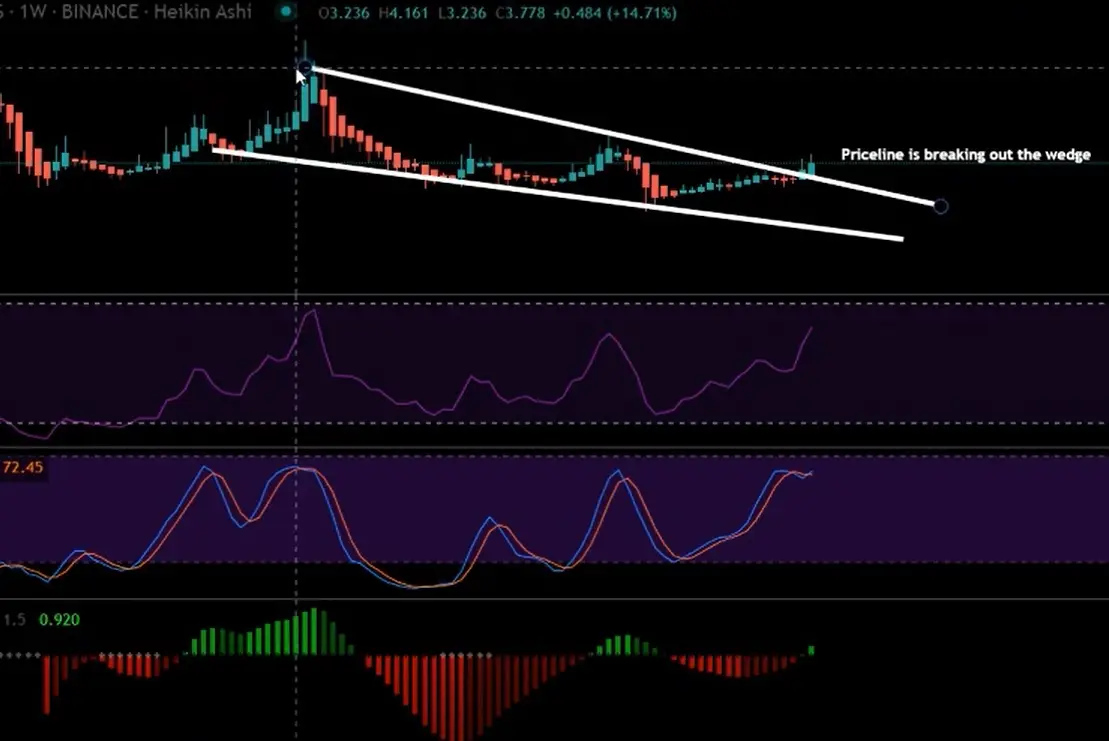
A big falling wedge is likely to be broken out:
And if we watch on the long-term weekly chart then the price action was moving in a falling wedge pattern. It was likely to move down after reaching the resistance of this falling wedge pattern. But after this announcement the priceline of Qtum coin turned very strong bullish and at this time we have second strong bullish candlestick breaking out the resistance of this falling wedge pattern. And if you watch the different indicators on the same weekly chart. Then the RSI has still more capacity to move up and to enter the overbought zone. The stochastic was in the bear cross and likely to move down but suddenly we have again received the bull cross by the stochastic indicator and the momentum indicator is also turned very strong bullish.
The SMAs are getting broken out:
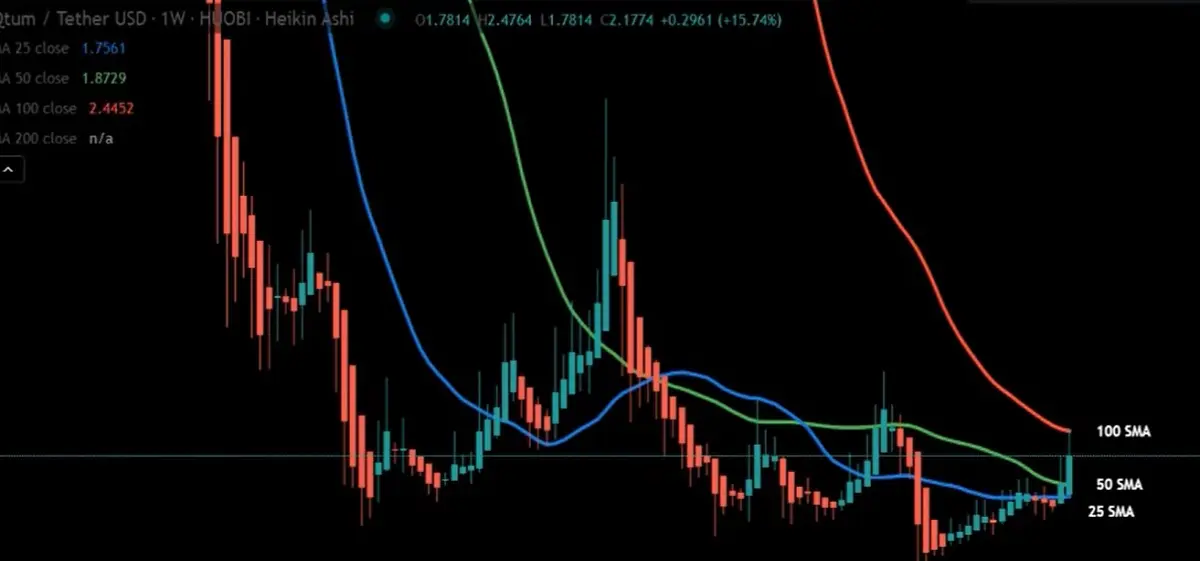
If we watch the simple moving averages on the long-term weekly chart. Then it can be observed that the price action of Qtum has broken out 25 simple moving average and at this time it is breaking out the 50 simple moving average and having a strong resistance of 100 SMA. But if the price action will be able to break out the resistance of wedge pattern on the same weekly chart then Qtum will easily break out the 100 simple moving average as well.
The most significant bullish signals:
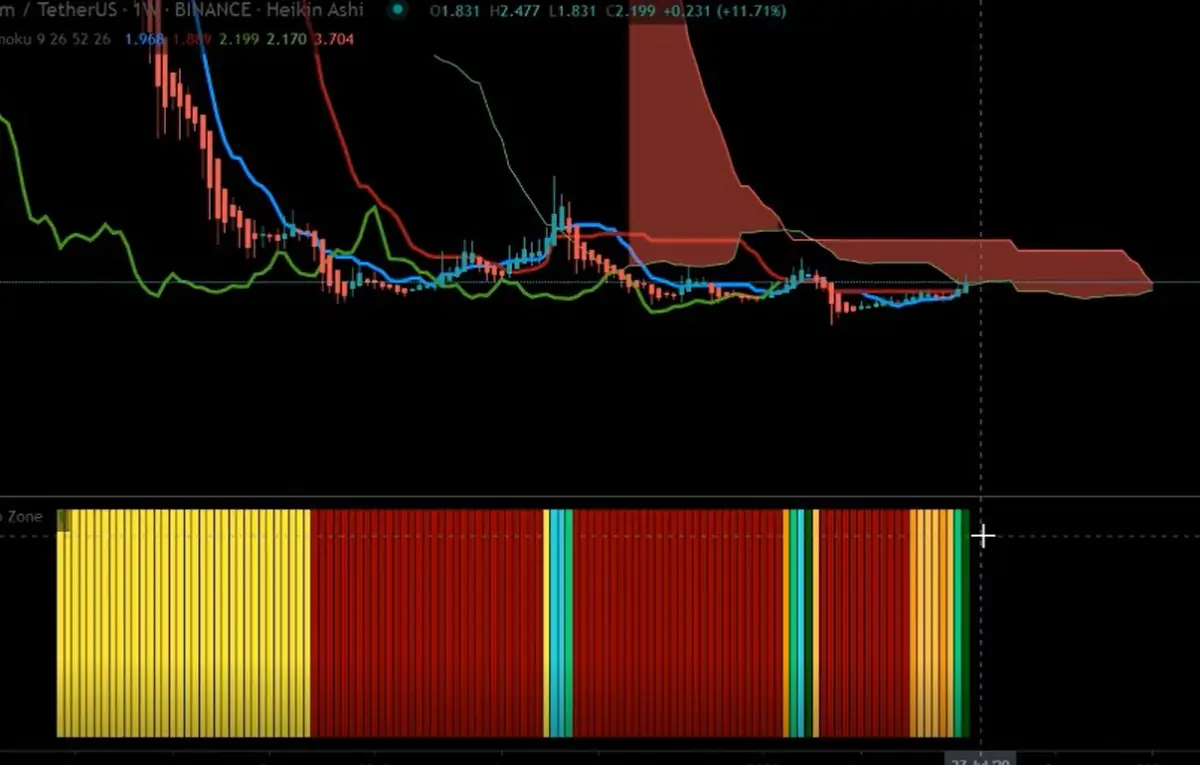
The most powerful and significant bullish signals are the Ichimoku cloud and the Chop zone indicators on the weekly chart. The price action of Qtum coin is entering the bearish cloud and the cloud is also getting squeezed. Therefore I am expecting soon the priceline will be reached up to the edge of this cloud to make an attempt for the break out from the cloud. And once the priceline of Qtum coin will be able to break out this bearish cloud. Then it can turn more powerful bullish. And this bullish move will be stronger than the previous move. The Chop zone was strong bearish but now it has turned strong bullish.
Click here to create free account on tradingview to watch and play the chart on realtime
Conclusion:
the Qtum coin has the strong support of the upcoming big event. Therefore we can believe in these bullish signals that are appearing on the daily and on the long-term weekly charts. But for the safer side, we should use the support of the channel that was formed on the daily chart as stop loss to minimize the risk factor.
Note: This idea is education purpose only and not intended to be investment advice, please seek a duly licensed professional and do you own research before any investment.
Don't forget to follow my blog as below:






