
The Formation Of Gartley:
Hedera Hashgraph (HBAR) has formed bullish Gartley pattern and entered in potential reversal zone.
Lets have a look on the move of price action to see how perfect this pattern is driven:
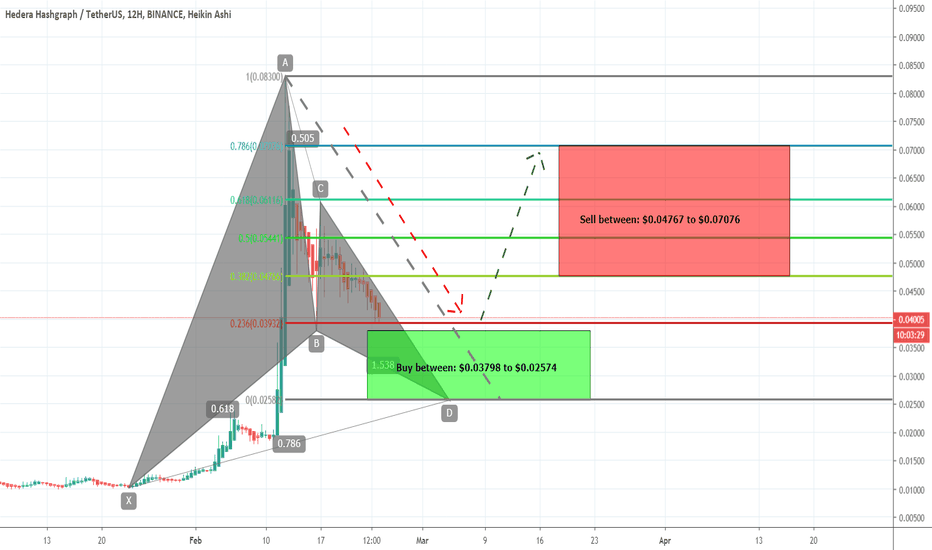
After initial leg (X to A) the A to B leg is retraced between 0.618 to 0.786 Fibonacci and then B to C leg is projected between 0.382 to 0.886 of A to B Fibonacci projection area and last leg (C to D) is expected to be retraced between 0.618 to 0.786 Fibonacci and this will be our potential reversal zone to buy.
Buying And Sell Targets:
The buying and sell targets according to harmonic BAT pattern should be:
Buy between: $0.03798 to $0.02574
Sell between: $0.04767 to $0.07076
So this very small term 12 hour chart has capacity to produce up to 174% massive profit.
Stop Loss:
The potential reversal zone area can be used as stop loss in case of complete candle sticks closes below this level.
I have shared the link for the chart above, I will be keep posting more trading ideas.






