
Overview of Recent Developments
Hello, friends! I hope you're doing well. In this update, we're diving into the latest developments regarding Gala. If you’ve been following my recent videos, you’ll recall that we discussed Gala’s formation of a down channel on the daily time frame chart. Let's take a closer look at what has transpired since then.
Current Status of Gala
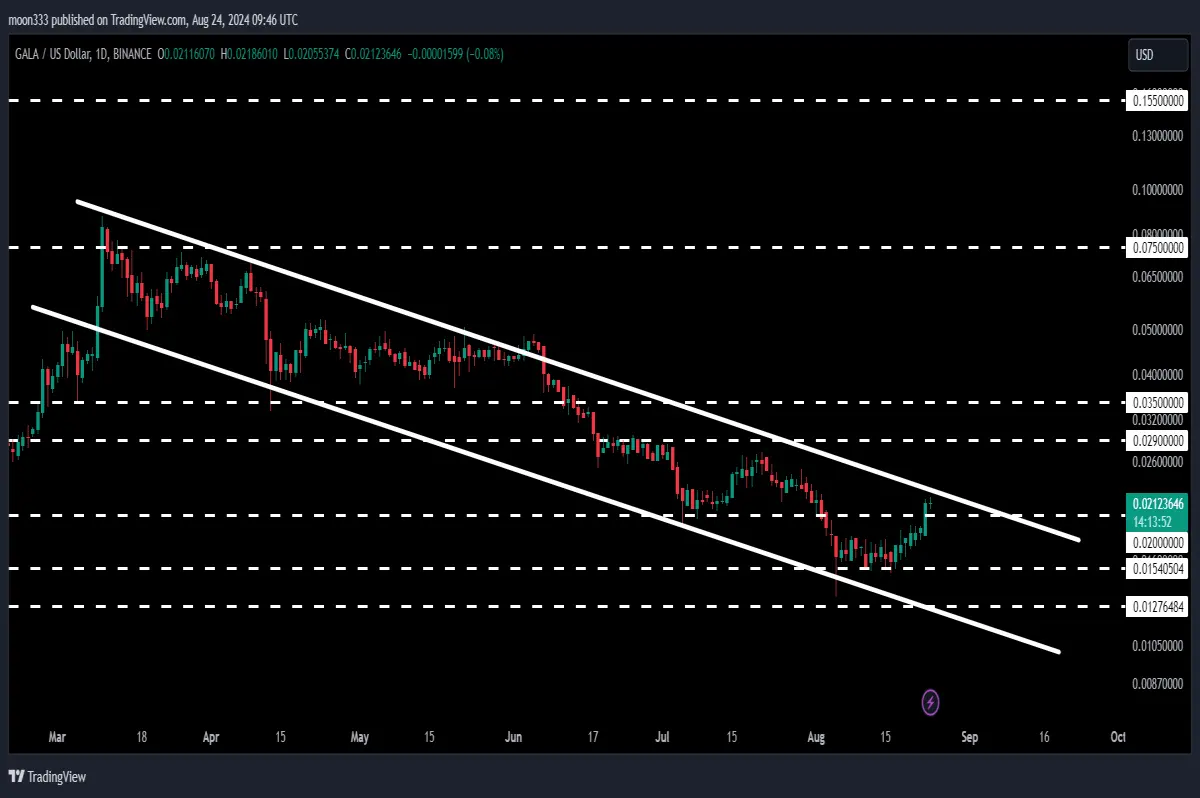
Since March 9, 2024, Gala has been navigating within this down channel. There was a brief fake-out, but the price re-entered the channel. Recently, after bouncing off the support level, Gala is approaching the channel's resistance and the significant long-term resistance of 2 cents.
Analyzing the Down Channel Breakouts
Daily Time Frame Analysis
On the daily time frame chart, we see Gala continuing its movement inside the down channel. The price is set to test the channel's resistance and the 2-cent resistance level. This intersection is critical as it could determine the next major movement for Gala.
For detailed analysis, you can watch the below video:
Weekly Time Frame Insights
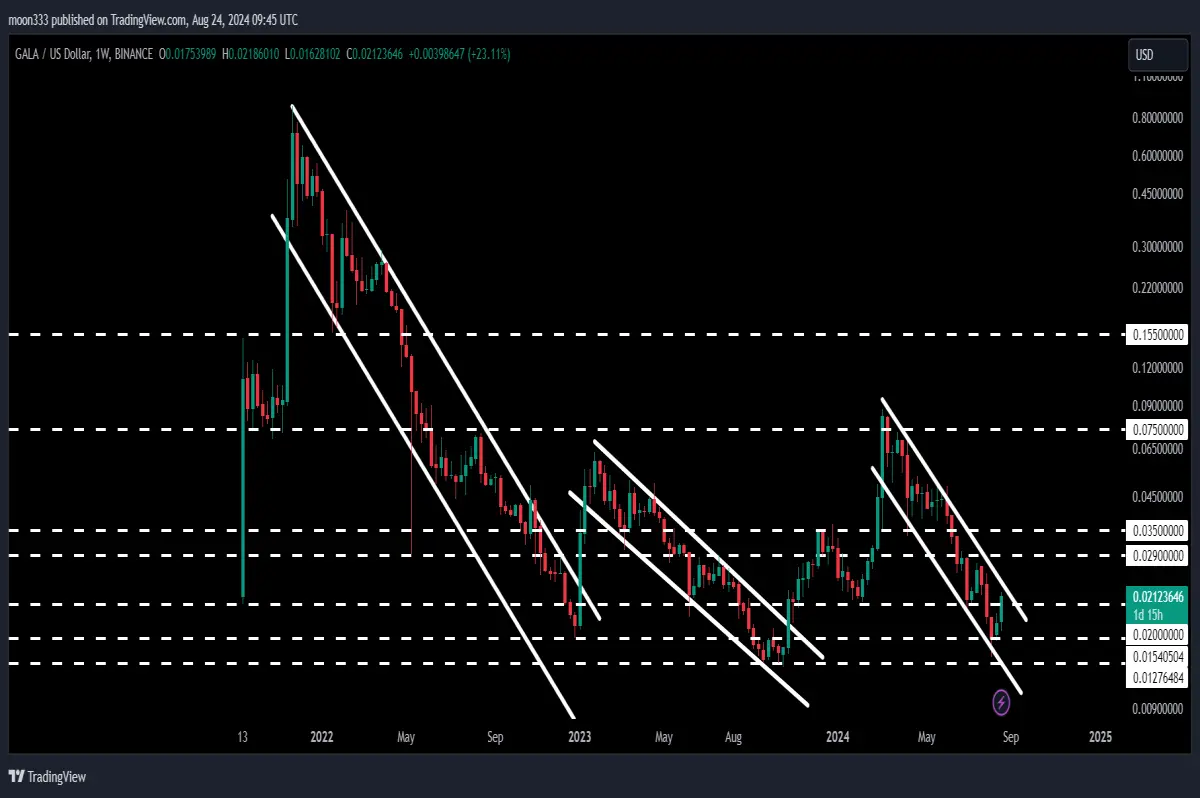
Switching to the 7-day time frame chart, we observe a significant breakout from a major down channel. Initially, Gala broke out from this channel, followed by another breakout from a smaller down channel. We are now on the verge of breaking out from yet another down channel. This breakout is crucial as it signals potential upward momentum.
Key Resistance Levels
Gala is approaching two critical resistance levels: the 2-cent mark and the resistance of the current down channel. The 2-cent level has previously acted as a strong support, so it may now serve as a formidable resistance. If Gala breaks through this resistance, the next technical target is at the top of the channel, approximately 8.3 cents. This level is slightly above the long-term resistance of 7.5 cents.
Potential for Future Gains
On the 7-day chart, Gala has already demonstrated a notable rally after breaking out from a significant down channel. The rally from the low to the recent high represents a gain of over 467%. If the current down channel breaks, the technical target for this move could be between 80 cents to $1.
Conclusion
In summary, Gala is at a pivotal moment, testing critical resistance levels on both the daily and weekly charts. The outcomes of these tests will be crucial in determining the future price movement of Gala.
For more detailed trading signals and to support this analysis, consider joining as a YouTube or Patreon member. Links to join as below:






