
About Ethereum
Ethereum (ETH) is a platform for smart contracts which helps the developers to develop decentralized applications (DAPPs).
ETH is native currency uses Ethereum platform and the miners receive transaction fees using this currency.
There is no doubt that Ethereum is pioneer for smart contracts using blockchain based system.
On blockchain the smart contract runs like self driving computer application that auto executes when some certain conditions are met.
Smart contracts let the code to run exactly as they are developed without any interruption , system crash, censorship, fraud or any other interference.
It has potential to exchange of money property, shares or any thing which has any value.
This network went live on 2015.
The technical analysis of Ethereum price
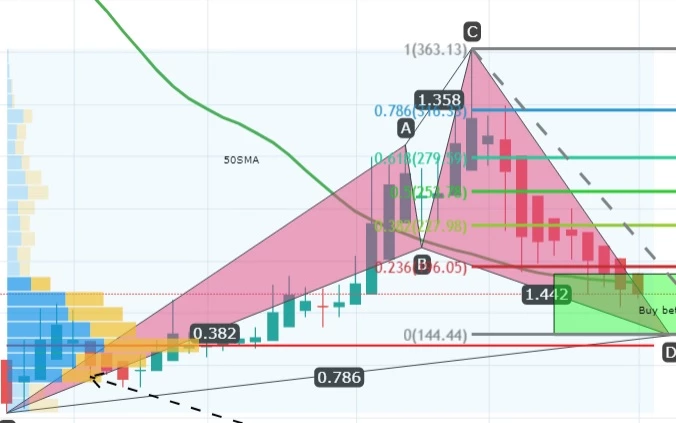
On week chart priceline of Ethereum / US Dollar has formed a bullish cypher pattern.
The initial leg was started from Dec 2018 then A to B leg retraced between 0.382 to 0.618 Fibonacci and B to C leg projected between 1.272 to 1.414 of A to B leg's Fibonacci projection.
Now the C to D leg is retraced between 0.618 to 0.786 Fibonacci as perfectly required for bullish Cypher pattern.
Now the price action has entered in potential reversal zone to take the bullish divergence.
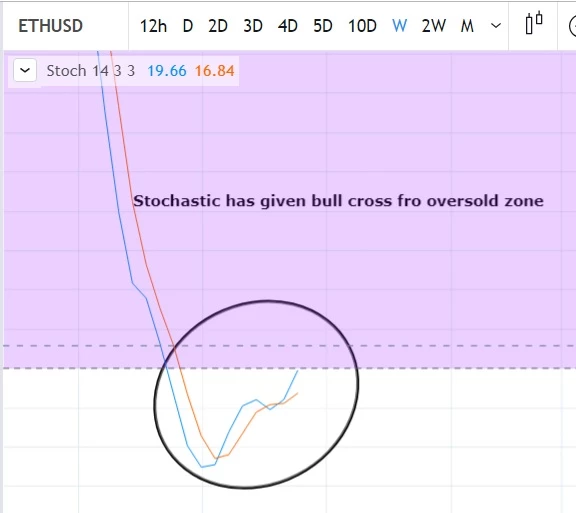
Stochastic has given bull cross fro oversold zone.
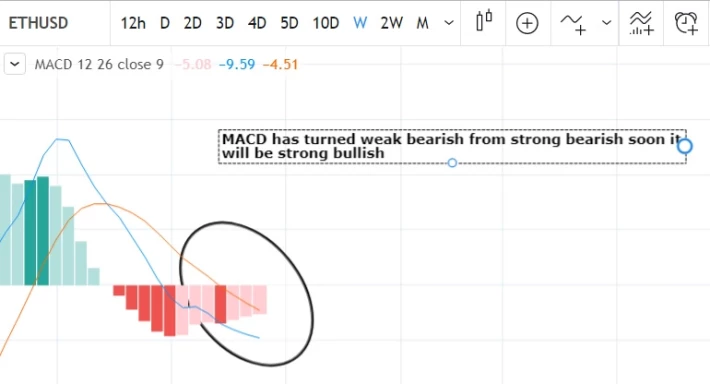
MACD has turned weak bearish from strong bearish soon it will be strong bullish.
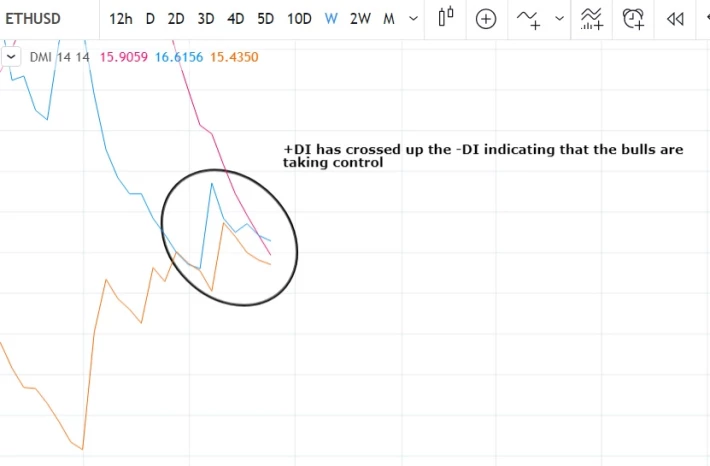
In Directional movement +DI has crossed up the -DI indicating that the bulls are taking control.
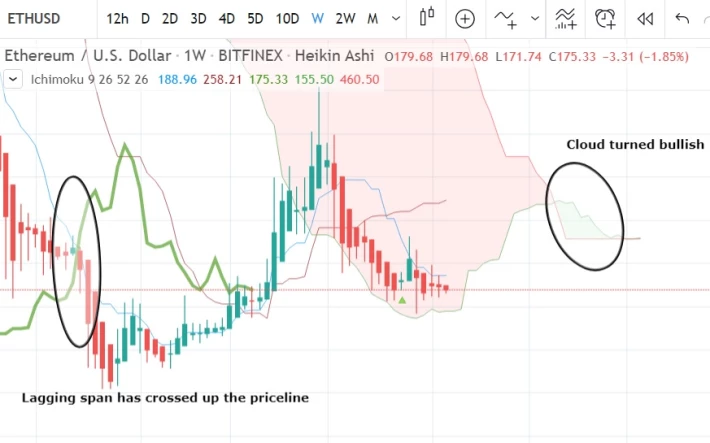
In ichimoku cloud the Lagging span has crossed up the priceline and cloud is turned bullish after Oct 2018.
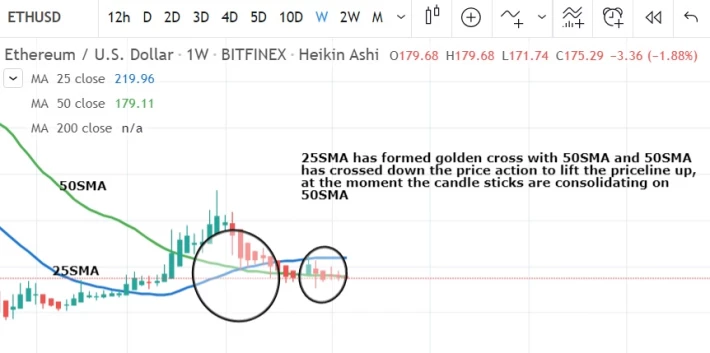
25 simple moving average has formed golden cross with 50 SMAand 50 SMA has crossed down the price action to lift the priceline up, at the moment the candle sticks are consolidating on 50 SMA.
After bull confirmation from all above indicators I have applied the Fibonacci calculation method on pattern and the targets are as below:
Buy between: $190.30 to $143.09
Sell between: $227.21 to $316.18
But if the priceline crosses up the 0.786 Fibonacci projection of C to D leg which is the extreme of sell zone then the Ethereum can make higher high than the previous high of Jan 2018.
Regards,
Atif Akbar (moon333)
Disclaimer: The information contained in this article is for education purpose only, this is not intended to be investment advice, so please seek a duly licensed professional for investment advice.






