
Introduction
Hello everyone, I hope you're doing well! Today, we're diving into the latest updates on CRV. As discussed in previous videos, CRV recently broke out of a down channel on the daily time frame chart. In this video, we'll take a closer look at the current movements and what we can expect next.
Current Market Overview
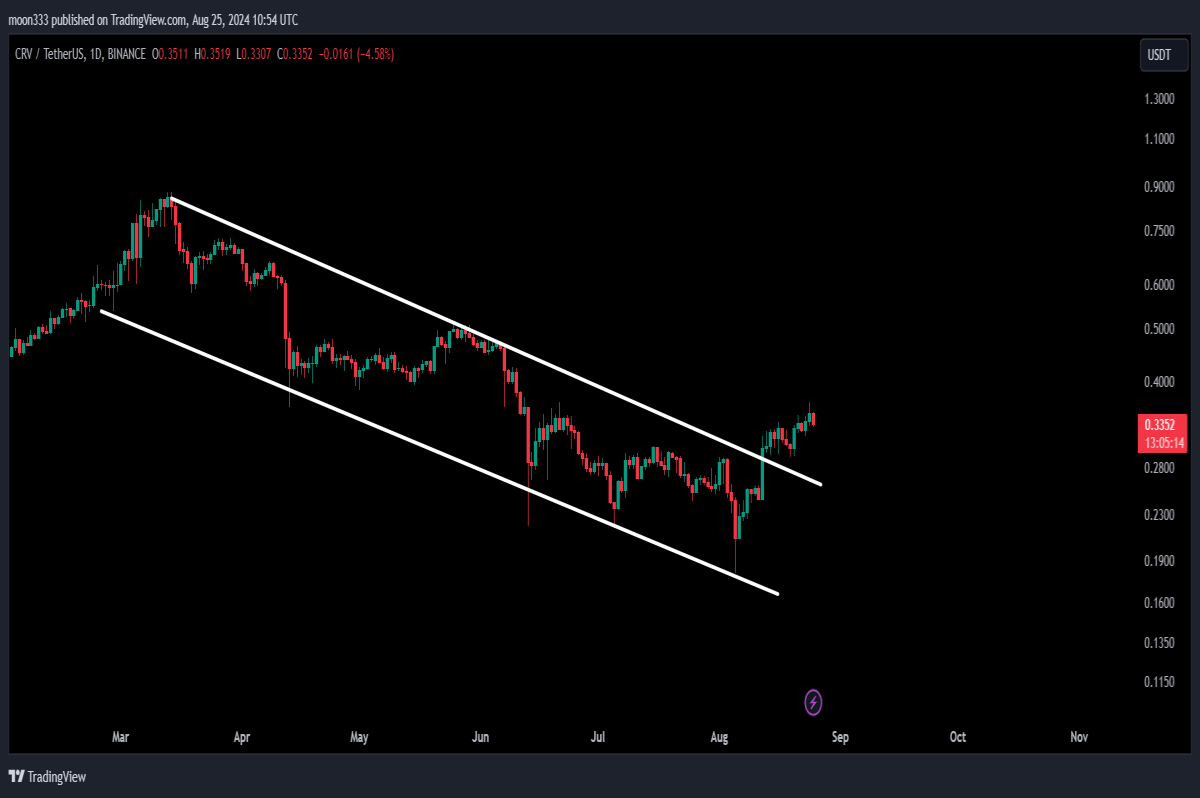
In my last video, which was shared two days ago, I highlighted the breakout from the down channel. Let's examine the current live daily time frame chart:
- Breakout Analysis: After breaking out of the down channel, CRV is approaching the downtrend resistance of a massive falling wedge pattern on the 7-day time frame chart.
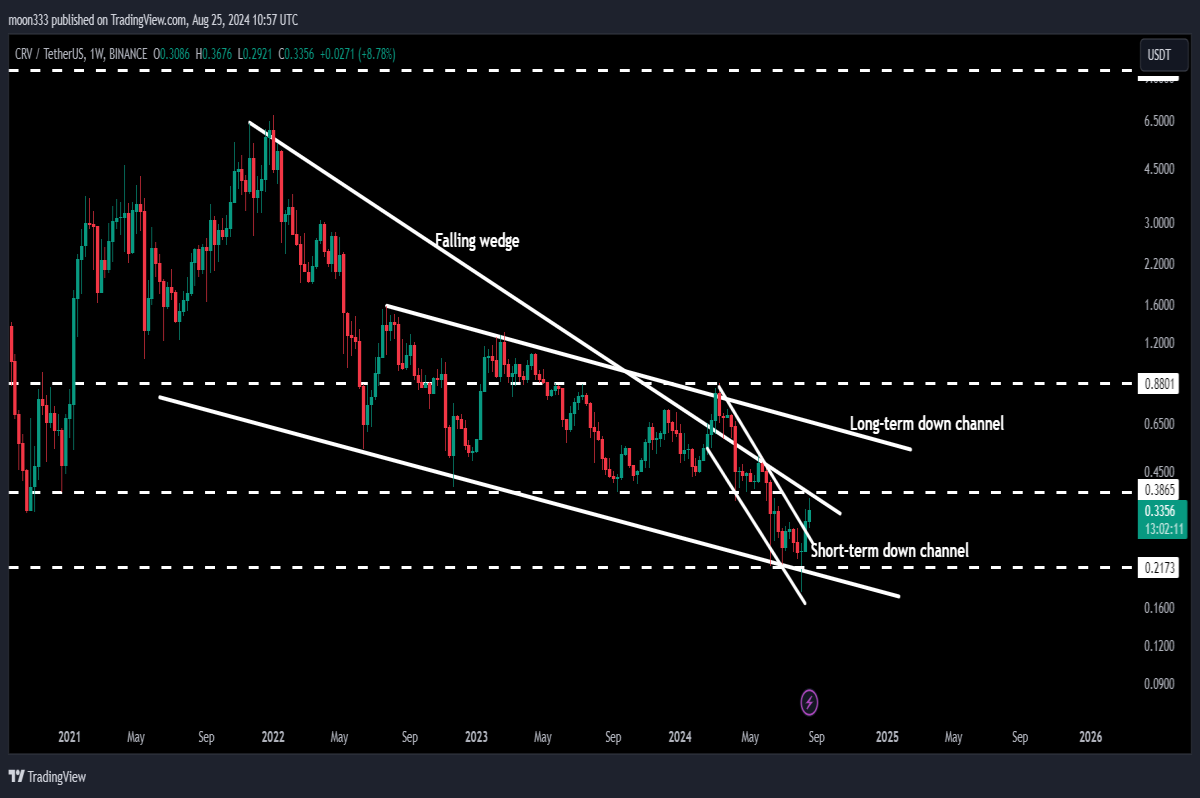
- Falling Wedge Pattern: On the 7-day chart, CRV is moving within a falling wedge pattern, and it’s approaching the resistance of this wedge.
- Down Channel: At the same time, CRV is also navigating within another down channel. Currently, the price is at the center of this channel and is nearing the long-term resistance level of 38.65 cents.
For detailed analysis, you can watch the below video:
Resistance Levels and Technical Targets
- Long-Term Resistance: The level of 38.65 cents has historically acted as a significant support and resistance level over several months.
- Technical Targets:
- From Down Channel Breakout: After breaking out of the down channel, the next technical target is approximately 88 cents.
- From Falling Wedge Pattern: The expected technical target for the breakout from this larger falling wedge pattern is between $6.50 and $7.
Chart Analysis
- Daily Time Frame: Over the past several days, CRV has been moving within a down channel, with a breakout recently observed. After this breakout, the price had a point of rejection at approximately 34 cents but has now surpassed that level.
- Resistance and Targets: The immediate focus is on breaking the long-term downtrend resistance. A successful breakout could lead to testing new highs and hitting the target of around 88 cents.
Conclusion
CRV has recently broken out of a down channel on the daily time frame and is now approaching the resistance of a significant falling wedge pattern on the 7-day chart. The price is also nearing a critical long-term resistance level of 38.65 cents.
Looking ahead, if CRV successfully breaks through these resistance levels, the next technical target is around 88 cents. Additionally, a breakout from the larger falling wedge pattern could see CRV reach between $6.50 and $7. Keep an eye on these key levels as they will be crucial for determining the future direction of CRV.
For more detailed trading signals and updates, consider joining as a YouTube or Patreon member, where regular insights and setups are shared.


