
Introduction:
In this update, we'll delve into Bitcoin's recent price action, focusing on the broadening falling wedge pattern and significant resistance levels. We’ll examine both the daily and weekly timeframes to provide a comprehensive analysis of potential future movements.
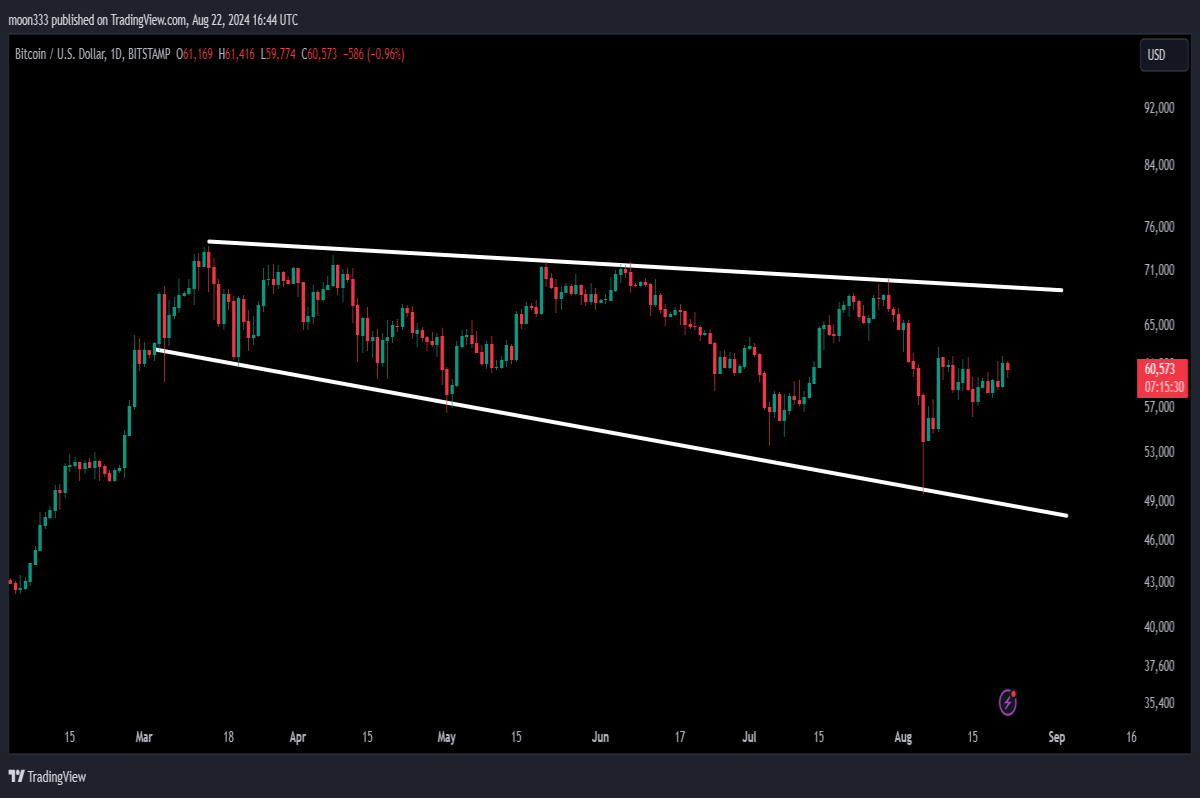
Broadening Falling Wedge Pattern
Bitcoin has been moving within a broadening falling wedge pattern on the daily timeframe. Recently, we saw a significant bounce from the support of this pattern, which is crucial for identifying potential upward momentum. This bounce follows a pattern of lower highs and lower lows, suggesting that Bitcoin is testing the resilience of its support levels.
For detailed analysis, you can watch the below video:
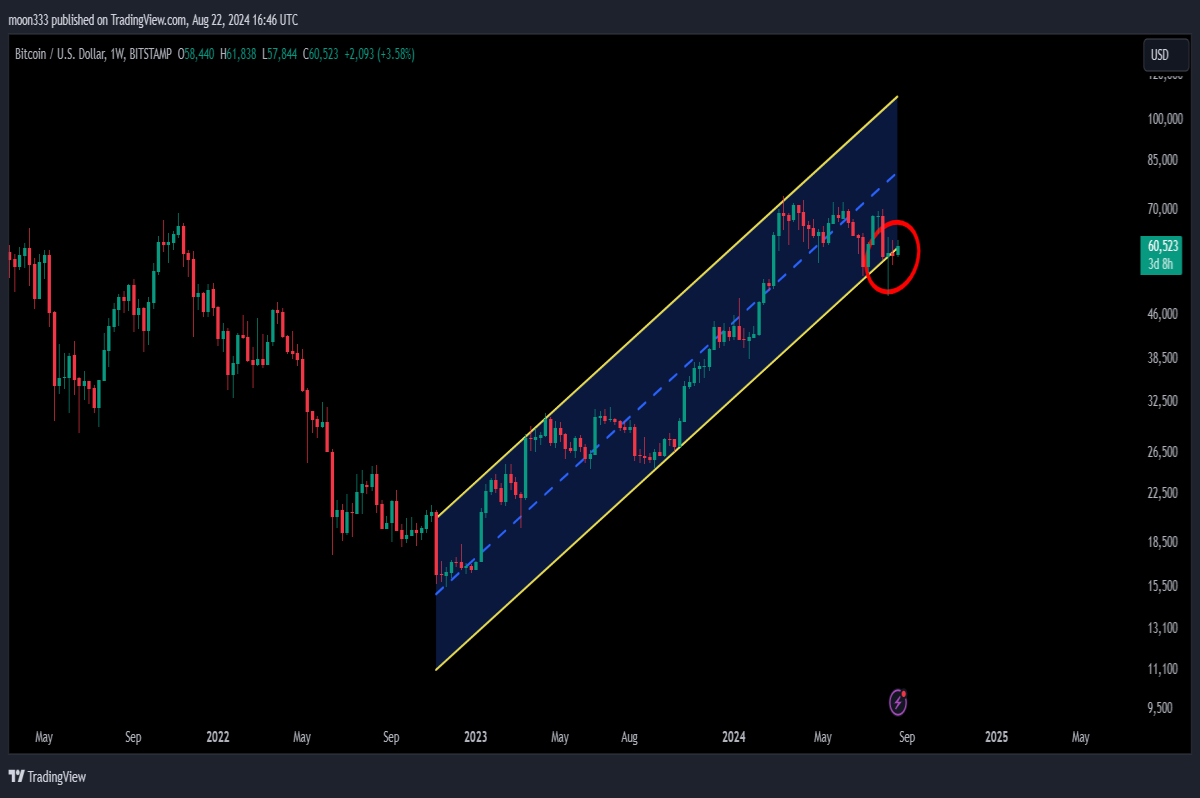
Breakout from Long-Term Uptrend Line
In addition to the wedge pattern, Bitcoin has broken out from a significant long-term uptrend line resistance. Previously, this trend line served as support but has now been flipped to resistance. Bitcoin has recently managed to break above this resistance, retest it as support, and is now gearing up for further movement.
Resistance and Moving Averages
On the daily chart, Bitcoin is attempting to break above the EMA 21, which is a key short-term resistance. The price is also approaching the 50-day and 200-day simple moving averages (SMAs). Currently, the 200-day SMA and 50-day SMA have formed a death cross, a bearish signal that typically indicates potential for further downward pressure. However, in the context of a bull run, this death cross might present a buying opportunity, as it has in past bull markets.
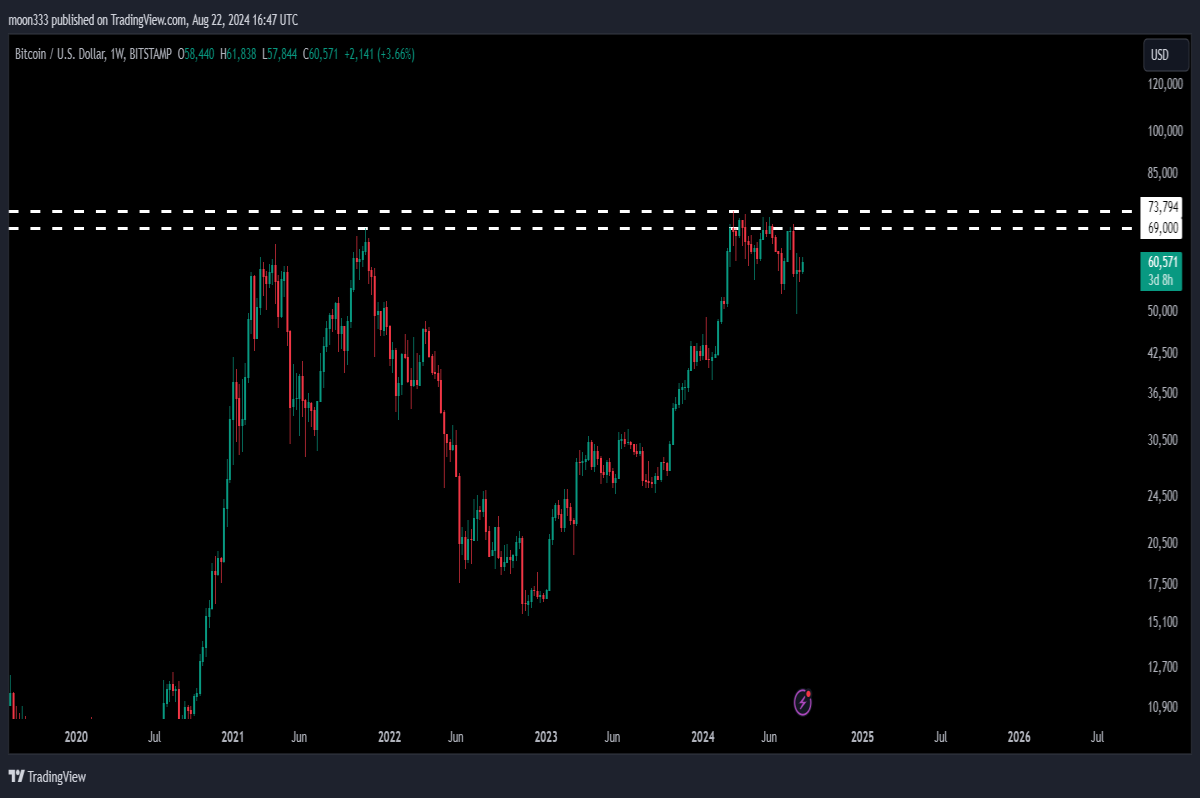
Weekly Time Frame Analysis
On the weekly chart, Bitcoin is confronting major resistance levels. The price recently encountered resistance around the $69,000 to $73,794 range, a level that has previously acted as a significant barrier. Despite recent price drops, Bitcoin quickly recovered and is now testing this resistance again.
Potential Targets and Resistance Levels
- Immediate Resistance: Bitcoin must break through the $60,000 resistance level, which was previously a strong support. Success here could signal further gains.
- Short-Term Target: If Bitcoin clears the $60,000 resistance, it will likely test the EMA 21 on the weekly chart. A breakout above this level could indicate further upward movement.
- Broadening Falling Wedge Target: The technical target for breaking out of the broadening falling wedge pattern is approximately $73,000 to $74,000. This level also coincides with significant long-term resistance.
- Long-Term Target: Should Bitcoin successfully break the $73,000 resistance, the next significant target is the resistance of the up channel, potentially reaching around $100,000.
Conclusion
Bitcoin's recent bounce from the support of the broadening falling wedge and the breakout from the long-term uptrend line resistance are bullish signs. However, overcoming significant resistance levels, including the $60,000 and $74,000 marks, will be crucial for sustaining upward momentum. Traders should watch for potential breakouts or rejections at these key levels, as they will likely dictate the next major move.
For more detailed trading signals and to support this analysis, consider joining as a YouTube or Patreon member. Links to join as below:


