
The world's 4th leading cryptocurrency Bitcoin Cash has completed a bullish setup lets have a technical analysis of price action:
https://www.tradingview.com/x/mTZPGEbN/
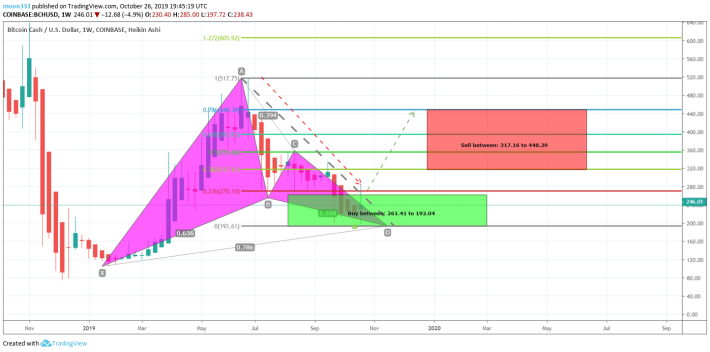
The price action of Bitcoin Cash / US Dollar has formed a bullish Gartley pattern and entered in potential reversal zone.
This PRZ area is also our stop loss point.
https://www.tradingview.com/x/aXpQR2Me/
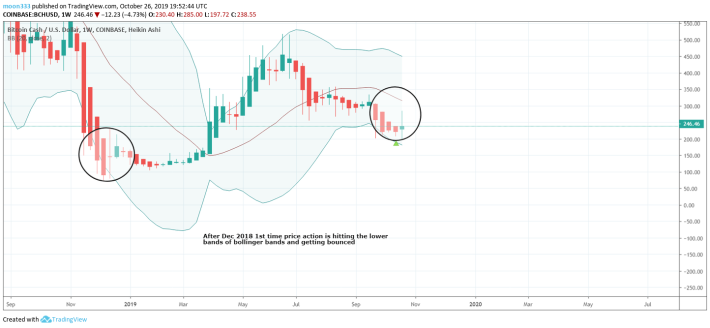
After Dec 2018 1st time price action is hitting the lower bands of bollinger bands and getting bounced.
https://www.tradingview.com/x/bJD5Hj5r/
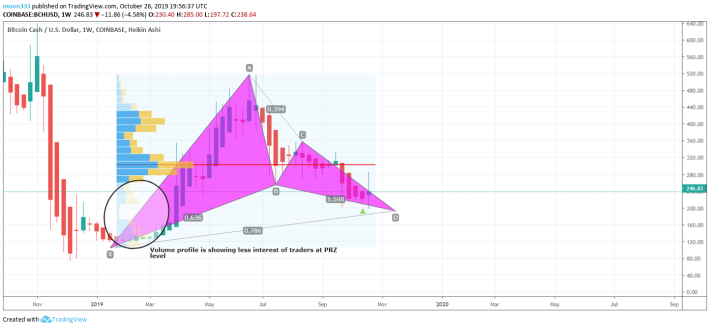
Volume profile of complete pattern is showing less interest of traders at PRZ level that is clear indication that priceline will be moved up from here.
https://www.tradingview.com/x/6rHhYSLz/
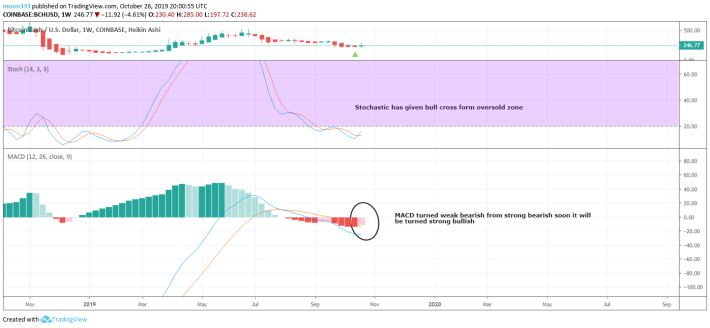
Stochastic has given bull cross form oversold zone and MACD turned weak bearish from strong bearish soon it will be turned strong bullish.
https://www.tradingview.com/x/o2F875HK/
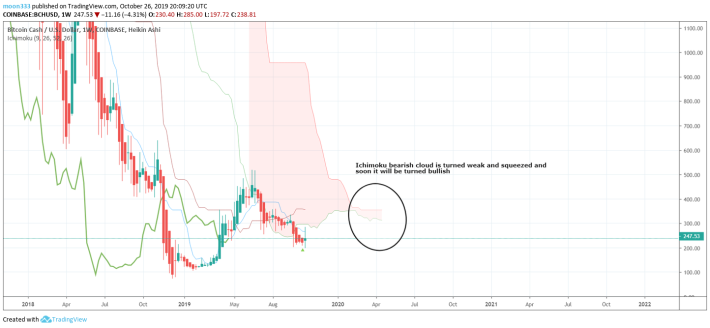
Ichimoku bearish cloud is turned weak and squeezed and soon it will be turned bullish.
https://www.tradingview.com/x/BkiITSYG/
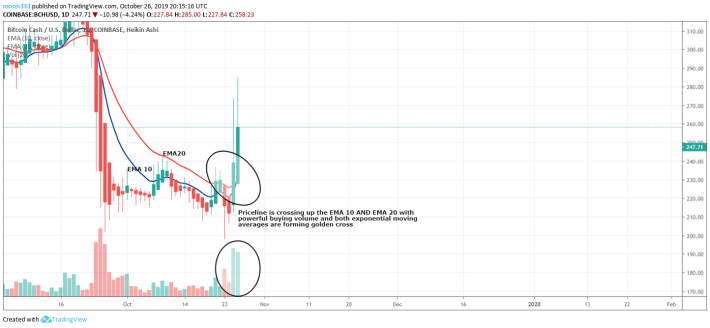
Priceline is crossing up the EMA 10 AND EMA 20 with powerful buying volume and both exponential moving averages are forming golden cross.
After receiving confirmation from technical indicators, moving averages, oscillators and patterns I have applied Fibonacci sequence method on the pattern to define the targets as below:
Buy between: 261.41 to 192.04
Sell between: 317.16 to 448.29
Regards,
Atif Akbar (moon333)
Disclaimer: Every word and figure of above article is purely result of my personal research and work you can share it using my reference moreover the information contained in this article is for education purpose only, this is not intended to be investment advice, so please seek a duly licensed professional for investment advice.


