
Introduction:
Hey friends! Welcome back to another update on Alien Worlds (TLM). In today’s post, I’ll walk you through the latest price action of TLM, focusing on key bullish patterns and providing an update on a recent trade signal that saw a powerful price pump.
Overview of TLM’s Bullish Patterns
In previous videos, I highlighted that TLM had broken out of a large falling wedge pattern, indicating a shift toward a bullish trend. Now, more recently, the token has formed another bullish structure—a downward channel. This pattern reflects consolidation within a narrow range, and we’ll be discussing its impact on TLM’s price movement.
If you look at the daily time frame chart, you can clearly see how the price of TLM has been moving inside this down channel. The most recent price action shows another rejection from the channel's resistance, keeping the token locked within the range. Today’s analysis will focus on this recent move and its potential.

Recent Trade Signal for TLM
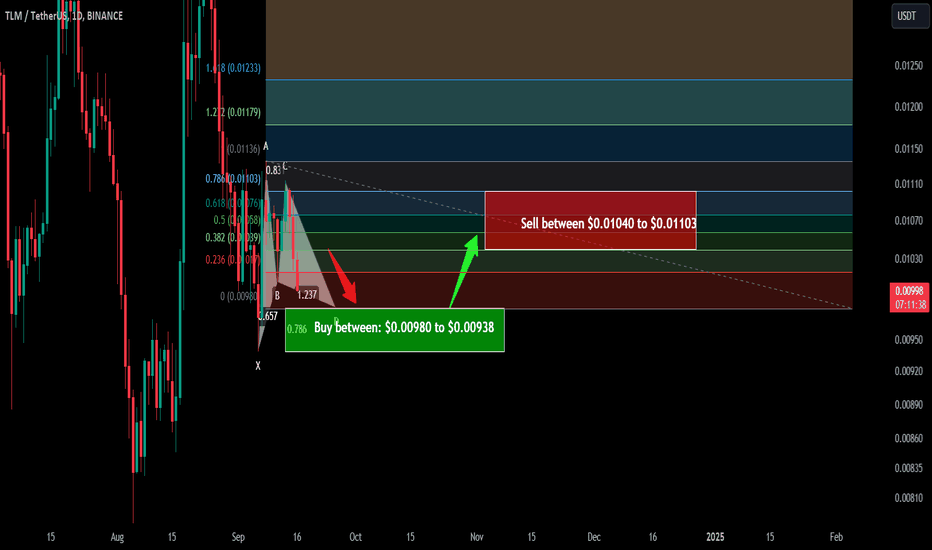
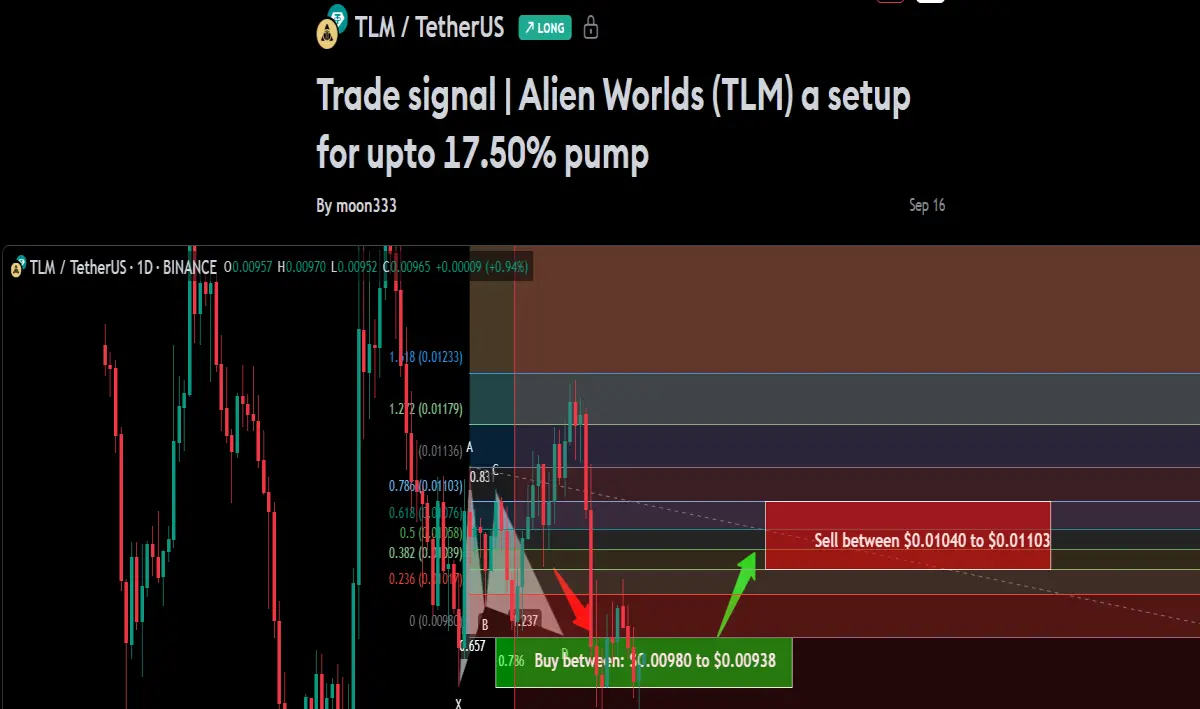
Before diving deeper into the charts, I want to share a trade signal I posted on September 16, 2024, for my members. This trade signal, based on a harmonic bullish Gartley pattern against the US Dollar on the daily chart, led to a 31% price pump!
In this setup, the buying and selling zones were clearly defined. After entering the buy zone, the price reversed, testing the support once again before rallying for an impressive pump. If you’re interested in receiving more signals like this, feel free to join me as a YouTube or Patreon member, where I regularly share such trading opportunities.
TLM signal before pump:
TLM signal after the pump:
Click here to visit this signal
TLM Price Movement: Downward Channel and Rejection Points
Now, let’s return to the live daily time frame chart. Since early 2024, TLM has been consistently bouncing between the support and resistance of the downward channel. We’ve seen multiple rejections at the top of the channel and bounces from the support levels. At the moment, the price has been rejected again by the channel’s resistance.
If the price pulls back to the channel's support, it could test a level around $0.048. However, given the overall bullish structure of this channel, I expect TLM to eventually break out to the upside.
Price Target on Breakout
If TLM breaks out from the channel, we can anticipate a technical target of $0.035—the top of the channel. It’s worth noting that this $0.035 level has historically acted as a significant resistance point, where TLM’s price has been rejected multiple times in the past.

Long-Term Outlook: Falling Wedge Breakout
Shifting focus to the 7-day time frame, we see that TLM has already broken out of a major long-term falling wedge pattern. The target for this breakout sits between $0.80 to $1, signaling a much larger potential move for the token over time. However, for now, the $0.035 resistance remains a key hurdle.
Conclusion
In summary, TLM continues to trade within a bullish downward channel, with the potential to break out and retest the $0.035 resistance level. The long-term outlook remains optimistic, with an eventual target of $1 based on the falling wedge breakout.
If you enjoyed this analysis, don’t forget to hit the like button and subscribe to blog for more updates! And if you’re interested in receiving daily trade signals, consider joining me as a YouTube or Patreon member for exclusive insights. The links are available as below:
Take care, and happy trading!






