
Hey friends, I hope you're well! Welcome to the latest update on Artificial Superintelligence Alliance. In my previous videos & articles, I discussed how the Artificial Superintelligence Alliance recently broke out of a down channel on the daily time frame chart. Today, we’ll take a closer look at the current price action, the recent breakout, and what to expect moving forward.
Recent Breakout and Resistance Rejection
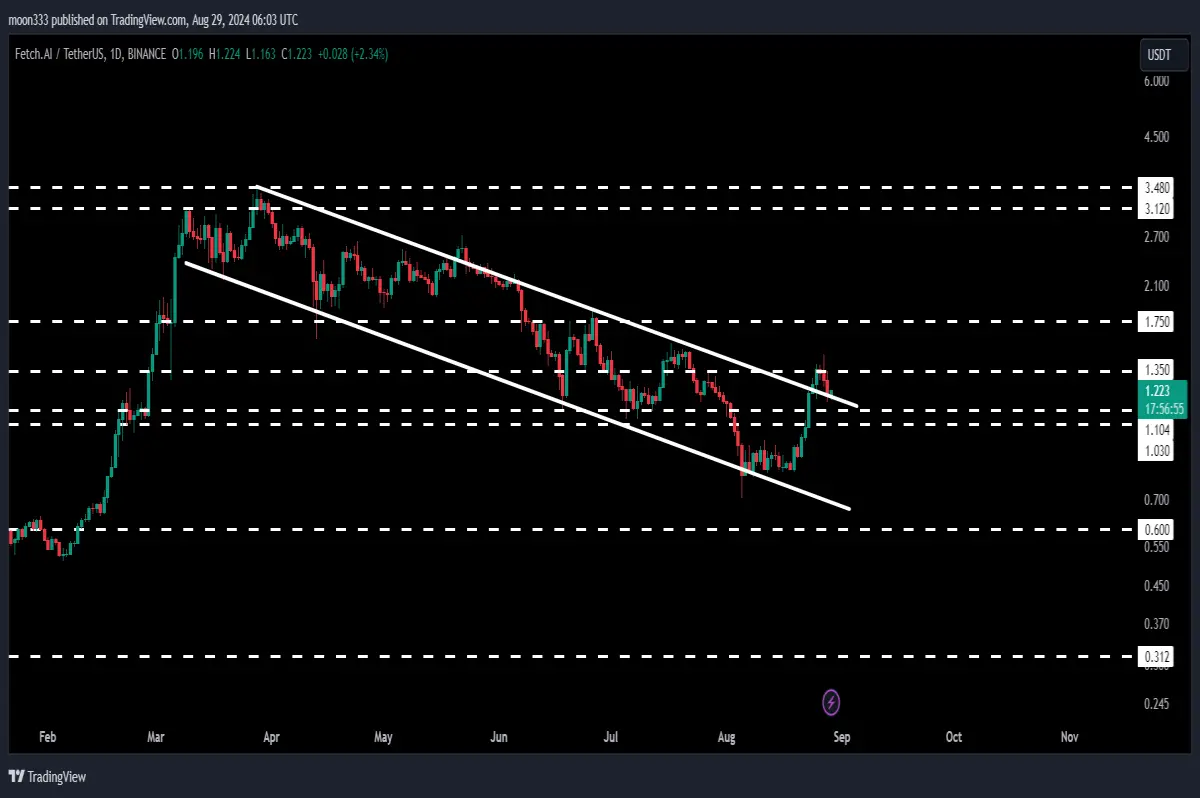
A few hours ago, I shared an update about the breakout from the down channel on the daily chart. If we look at the live daily time frame chart now, we can see that after this breakout, the price was rejected at the $1.35 resistance level. Currently, it appears that the price is about to retest the previous resistance of the channel, which could now act as support.
Massive Rally Following the 7-Day Time Frame Breakout
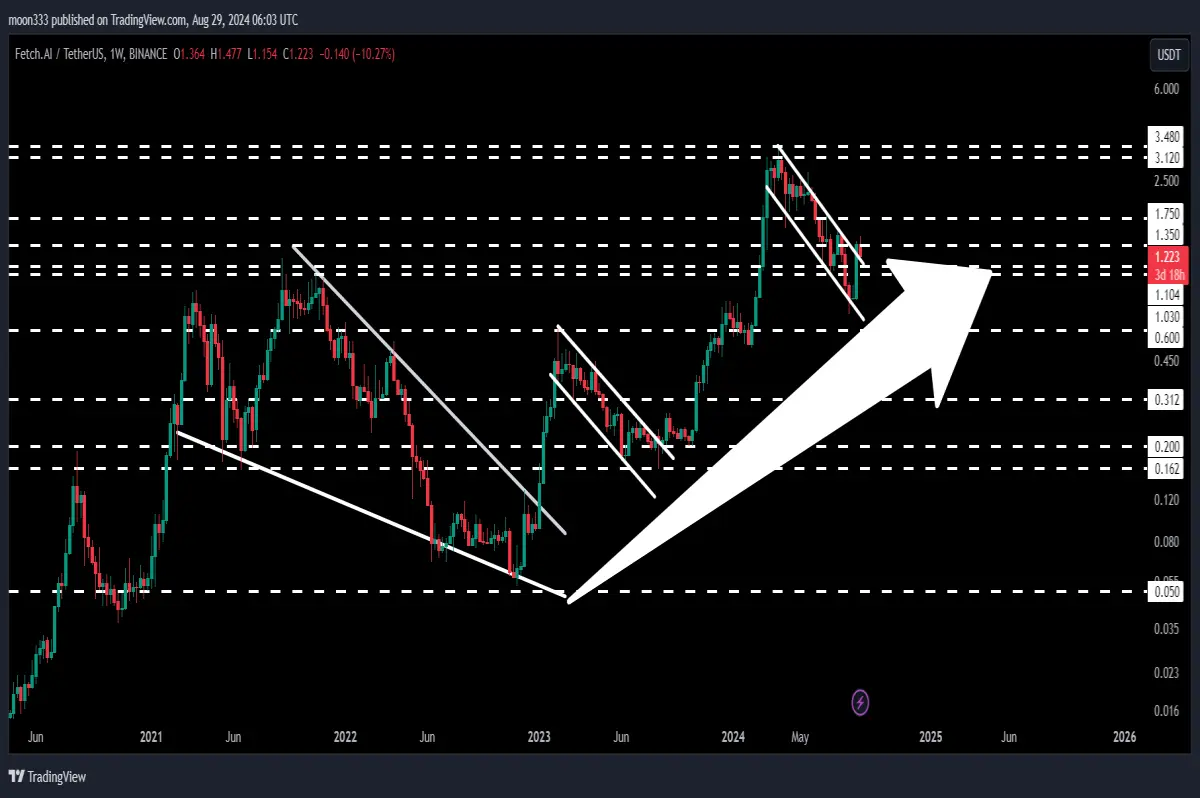
In addition to the daily chart, a significant breakout occurred on the 7-day time frame from a long-term falling wedge pattern. This breakout led to a massive rally, with the price surging more than 6500% from its low to the current high. This incredible rally is a key focus in today’s analysis, as it highlights the potential for continued upward momentum.
Daily Time Frame Analysis: Retesting Support Levels
Let’s dive into the daily time frame chart. The Artificial Superintelligence Alliance was moving within this down channel since March 15, 2024. There was a brief fake-out where the price reentered the channel, but recently, the price broke out again. However, it faced rejection at the $1.35 resistance level and is now poised to retest the channel’s previous resistance as support, which lies around $1.20.
Below this level, there is a long-term support zone ranging from $1.10 to $1.13. This support zone has previously played a crucial role in stabilizing the price, and it is likely to do so again if the price tests these levels before making its next move upward.
The technical target for this breakout from the down channel is the top of the channel, around $3.48. However, from $3.12 to $3.48, there is a very strong resistance zone that the price will need to overcome to reach this target.
Long-Term Resistance and Potential for Continued Rally
On the 7-day time frame, after breaking out from the falling wedge pattern, the price saw a substantial rally. However, it encountered a strong, long-term resistance zone, leading to multiple rejections. This resistance zone played a significant role in stalling the price's upward movement and caused it to consolidate within the down channel.
To continue this rally, the price must break out of this resistance zone. Given that the technical target for the recent down channel breakout is within this resistance zone, there is a high probability that the price will attempt to break out and continue its upward trajectory.
Conclusion
In summary, the Artificial Superintelligence Alliance is in a critical phase, with a recent breakout followed by a potential retest of support levels. The key resistance zones and technical targets suggest significant potential for future gains, provided the price can break through the obstacles ahead.
If you enjoyed this analysis, please hit the like button and subscribe to the channel for more updates. For additional trading signals, consider joining me as a YouTube or Patreon member. You can find the links as below.






