
Introduction
Hey friends, this is Atif Akbar, and welcome to the new update on Pepe Coin. In this update, we will discuss the recent price movements, important chart patterns, and potential future projections for Pepe Coin.
Recent Breakout and Resistance Levels
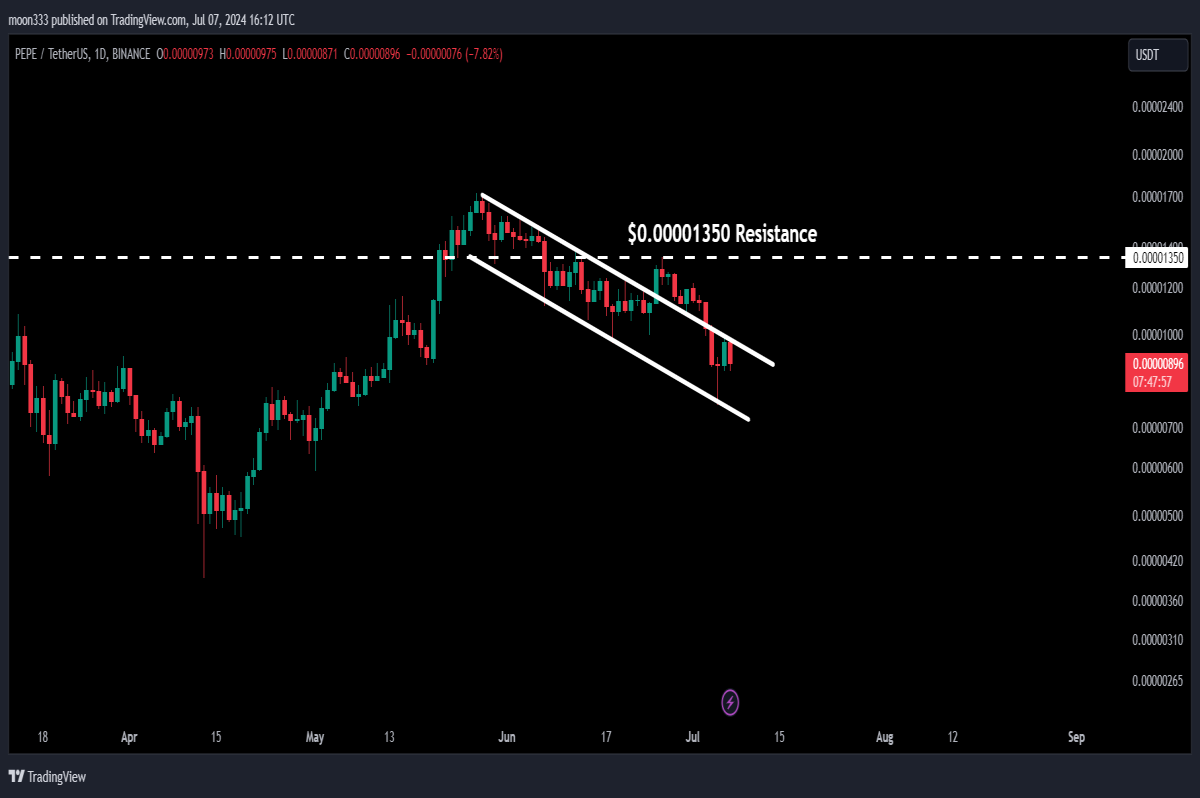
In my earlier articles, I highlighted Pepe's breakout from a down channel. However, the price failed to surpass the resistance at 1350, which had previously acted as support. After the breakout, the price re-entered the channel but bounced from the support, reaching the channel's resistance once again.
For detailed analysis, you can watch the below video:
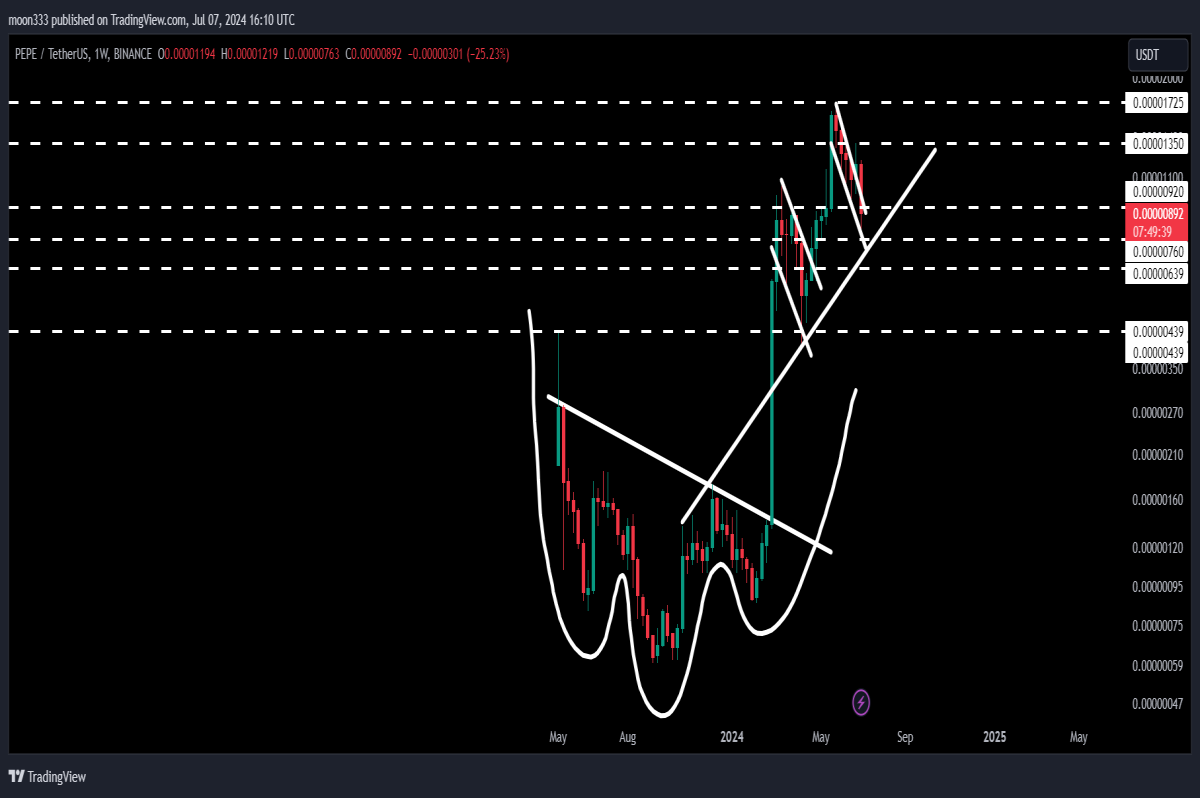
Weekly Time Frame: Inverse Head and Shoulders Pattern
On the weekly chart, Pepe formed a massive inverse head and shoulders pattern. After breaking the neckline, we saw a substantial rally of approximately 2775%. Despite the strong move, the price faced a fake out from the next channel and dropped after hitting resistance.
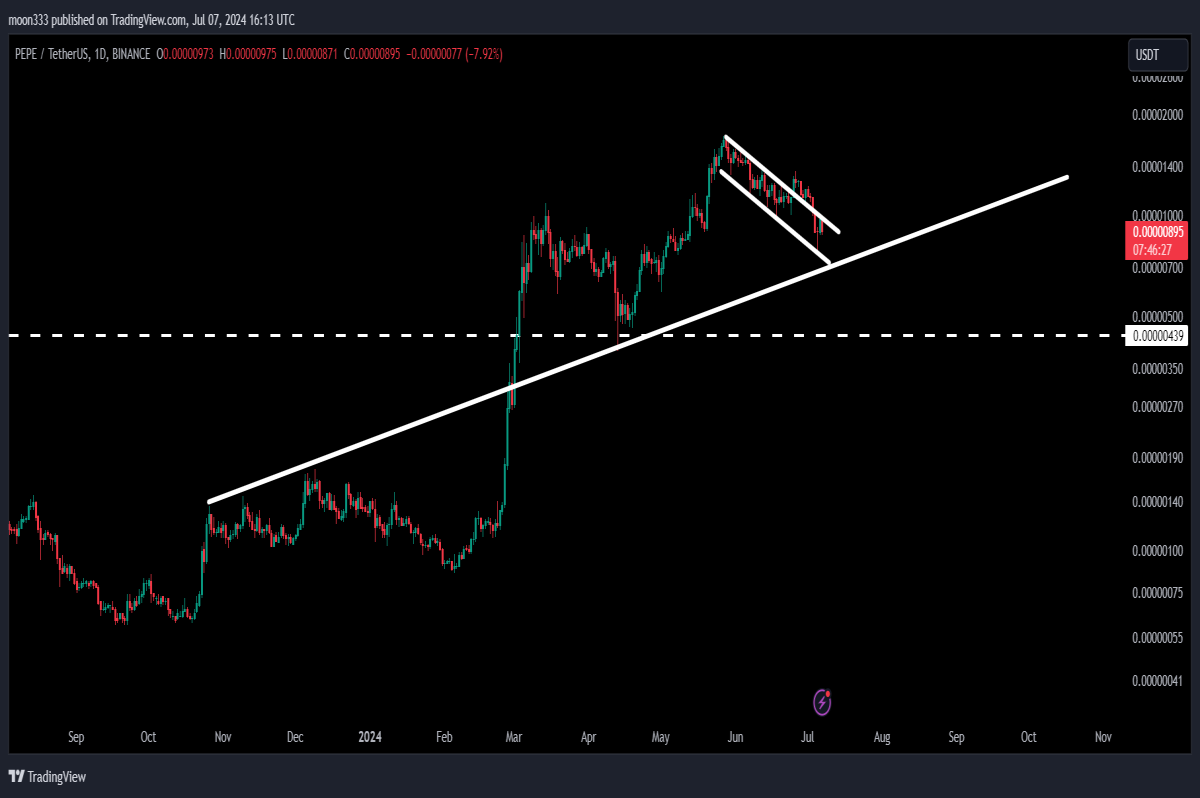
Long-Term Uptrend Support
Pepe has a long-term uptrend line support, previously acting as resistance in October 2023. This support was tested during the recent channel movement and could provide a strong base if the price moves down slightly.
Harmonic Pattern and Recent Trade Signals
I recently shared a harmonic bullish AB=CD pattern for Pepe on February 1, 2024. The trade setup included a buying zone, sell targets, and a stop loss. The price has reversed massively from the buying zone, achieving gains of approximately 1860% from the potential reversal zone.
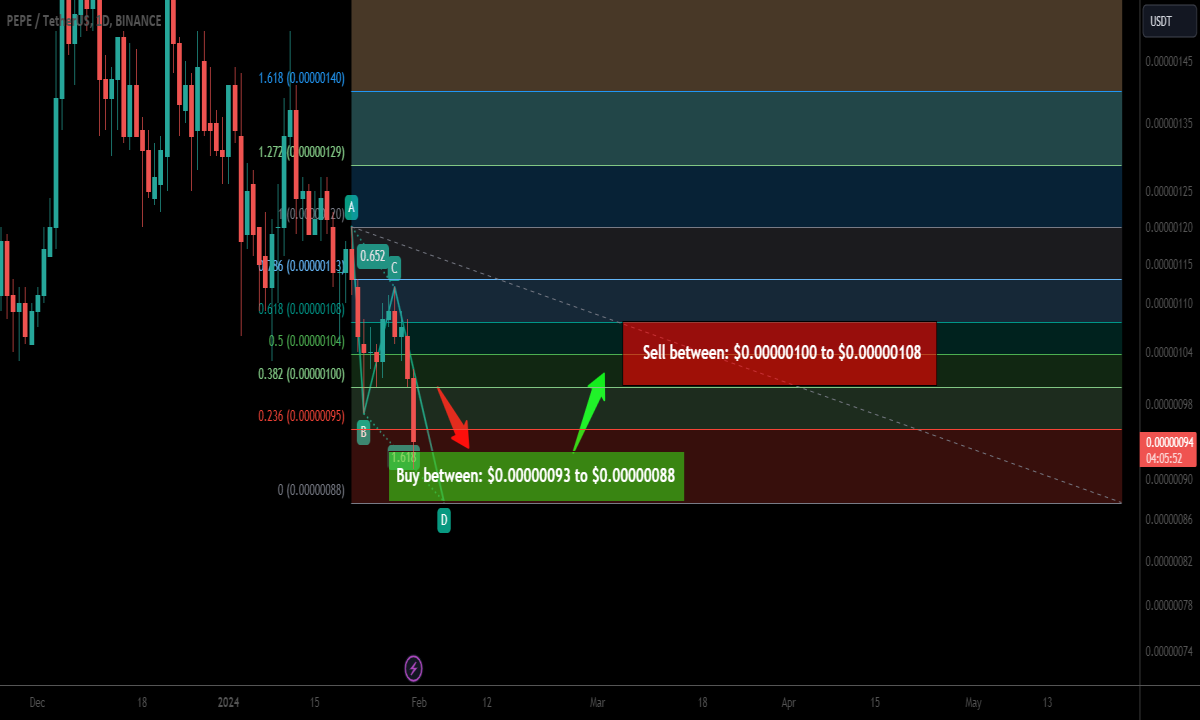
https://www.patreon.com/posts/trade-signal-for-97584018
For those interested in catching such opportunities, you can join me as a YouTube or Patreon member, where I share exclusive trading signals, links are at the footer of this article.
Detailed Chart Analysis
Inverse Head and Shoulders Pattern
Previously, I discussed the inverse head and shoulders pattern and its breakout potential. After breaking out, Pepe saw a significant rally and also broke an uptrend line resistance that had repeatedly acted as a barrier. This resistance has now turned into a solid support level.
Daily Time Frame: Down Channel and Resistance
On the daily chart, the price formed a down channel and broke out, reaching beyond the target. However, resistance at 1350 halted further gains. To continue the rally, Pepe needs to break the channel's resistance and the 1350 level.
Key Resistance and Future Targets
To sustain a long-term upward move, Pepe must overcome key resistance levels:
- Immediate resistance: $0.00001350
- Major resistance: $0.00001725
Breaking the channel's resistance and $0.00001350 could lead to the next target at $0.00001725, which aligns with the technical target from the down channel breakout.
Conclusion
Pepe Coin is currently navigating critical support and resistance zones. Breaking above the $$0.00001350 resistance and subsequently $0.00001725 could signal the continuation of the rally. Conversely, a drop below the support levels could lead to retesting lower supports. Stay tuned for further updates and trading signals by follow my blog and joining as a member, links for membership are as below:


