
GVT token has been dropping for the last 5 months.
But, lately it seems that we may have a pump.
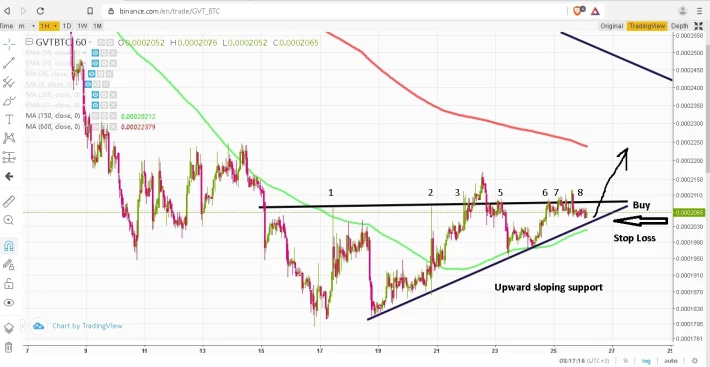
Tthis is a 4 hour chart in Binance, as you can see we have a "bullish ascending triangle pattern" which is a sign of possible bullish rally.
As you see, price is consolidating with rising lows and a horizontal ceiling. GVT has tried to go above this horizontal resistance 6 times, it touched 4 times and go above this rising support.
Here is a possible trade option: But LONG at 0.00002066 with Stop Loss at 0.000020 with only 3 % loss risk.
But price can easily increase to 0.00002253. In that case, profit 9%.
Of course, this triangular formation is one of many considerations in a trade.
So, let's see what we will come up.
You need to make your research since I am not a professional trader.
Thanks for reading. I hope you’ve found it helpful.
If you like this content, tip me please with some DAI or use one of the addresses bellow:
*********************************
-- Earn free Bitcoin,
** Sign up
** Cointiply here at http://cointiply.com/r/j38la and claim Bitcoin every hour (Don't forget to use the twitter promo code that is given by @CointiplyFaucet)
** Go to adBTC website https://r.adbtc.top/1194404
** Go to https://multimining.website/signup?referral=1334 (60 sathoshis per hour)
-- Sign up for Coinbase and get $10 Free Bitcoin:www.coinbase.com/join
-- Do not forget to use Brave Browser instead of Chrome ( download here BRAVE browser and get BAT token ($5)

For Donations:
BITCOIN: 1DaiEgPxzzud6giRWzwyiQQ7pNpQ99QrxL
ETHEREUM: 0xfe802d48e012414e4d4cd4cdce34ea8ac08ebf24
Sign up to Publish0x: https://www.publish0x.com?a=1YQdJWyeOG
Sign up to Binance Exchange: www.binance.com






