
Market activity is used as a base input for technical analysis concerning historical price data and volume. Analysts do not try to calculate the intrinsic value of a security, but instead, use visual charts and other instruments to detect trends that may signify potential behavior. As input, the two fundamental data sources of historical price behavior and volume are used.
Types of Charts
A graph is a graph showing how, with time on the horizontal ( x-axis) axis and price on the vertical axis (y-axis), the price of something varies over time. Chartists widely use four kinds of charts. The four examples below all use the same price details. We have assumed that the data is regular, but prices can also be generated using charts every month, every week, every hour, or every 5 minutes, etc.
Line Charts
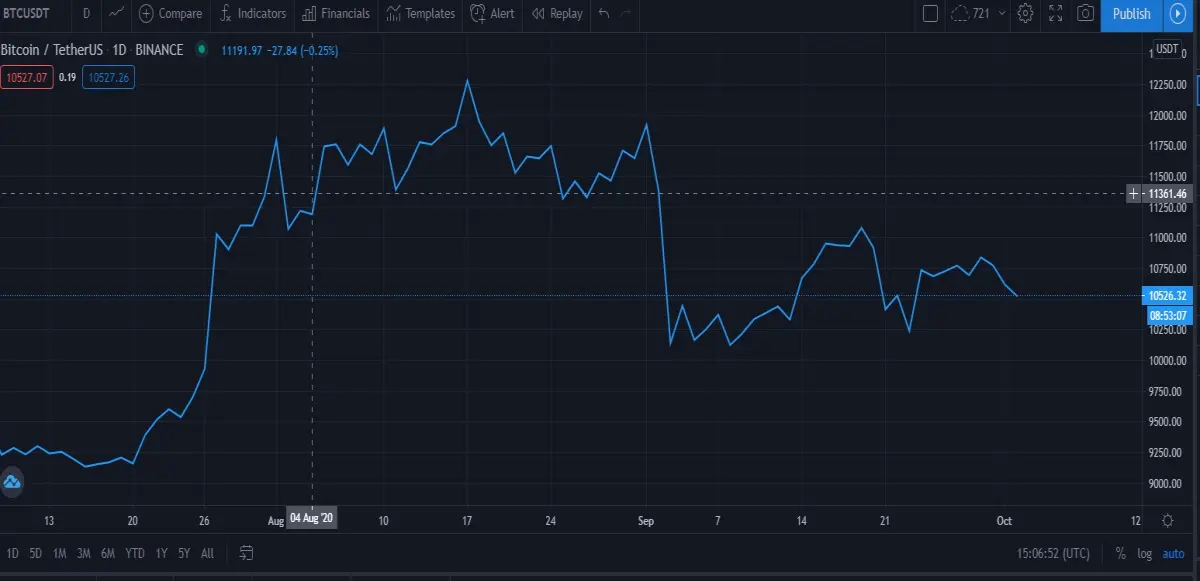
A 'line chart' displays the closing price of each day or time typically (although it is possible to provide an average price, or the opening price, etc.), connected by a line. Minimal price action information over the period chosen makes it a last resort when no other data is available.
Bar Charts
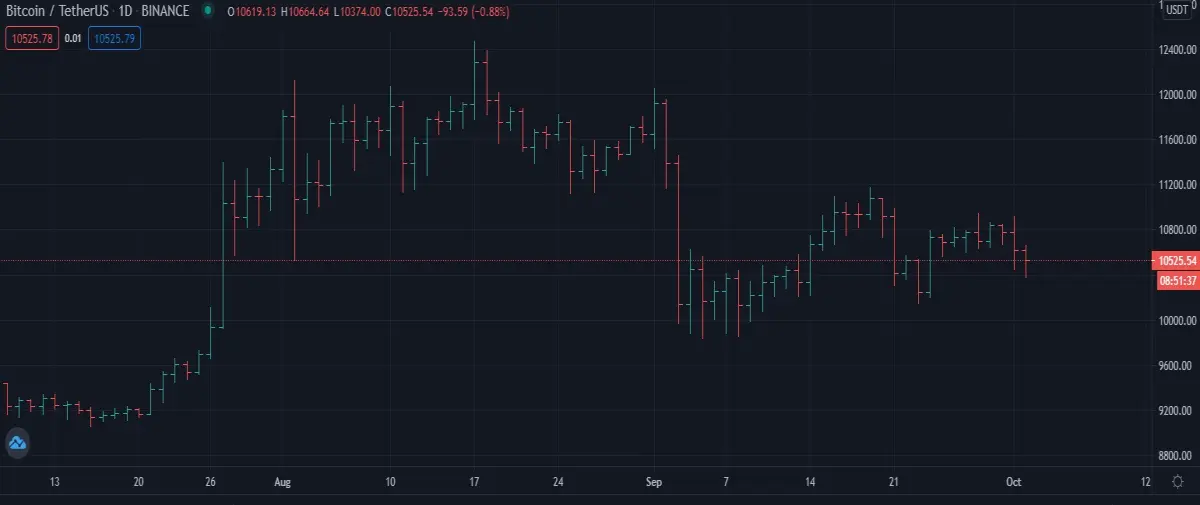
A 'bar chart' offers additional details on what happened during the day (or the corresponding period). The related high and low reached for the day links a vertical line for each data point. On the right side of each line, there is also a small mark, illustrating the closing price for the day. On the left of each line, a small mark shows the opening price for the day.
Candlestick Chart
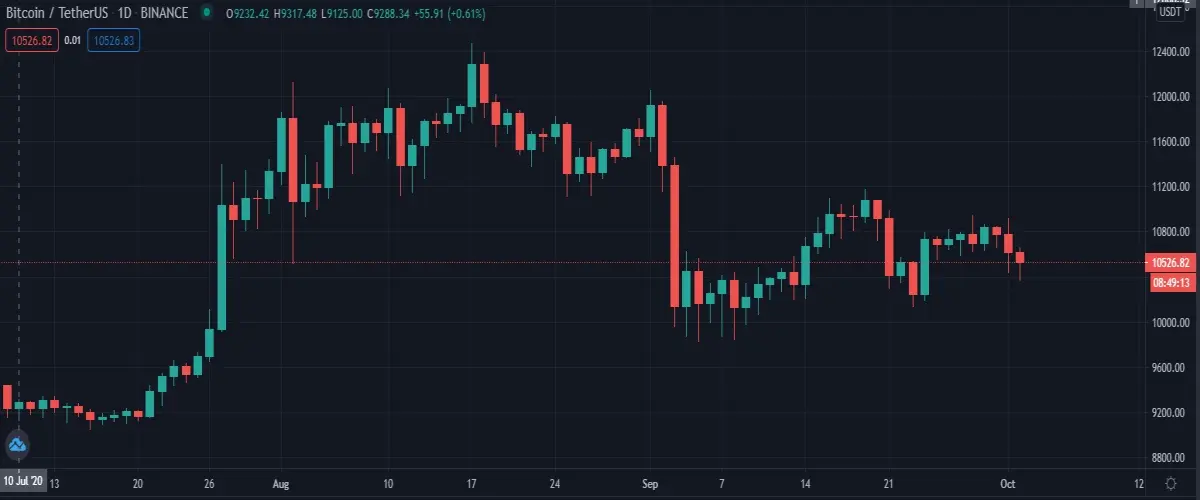
A 'candlestick chart' created by the Japanese, but in a more visually helpful way, displays the same data as a bar chart. Between the opening and the closing rates, a box is drawn. The 'real body' is this called. The real body is left clear when the closure is greater than the open one (a rising demand over the day). The actual body is filled in when the closure is lower than the open (a dropping demand over the day). The rest of the vertical line above the real body is considered the 'upper shadow' and the 'lower shadow' is regarded as the remaining vertical line below the real body. At every trading session, the chartist can instantly see what has happened. From these patterns, short term signals are also extracted.
Point and Figure Charts
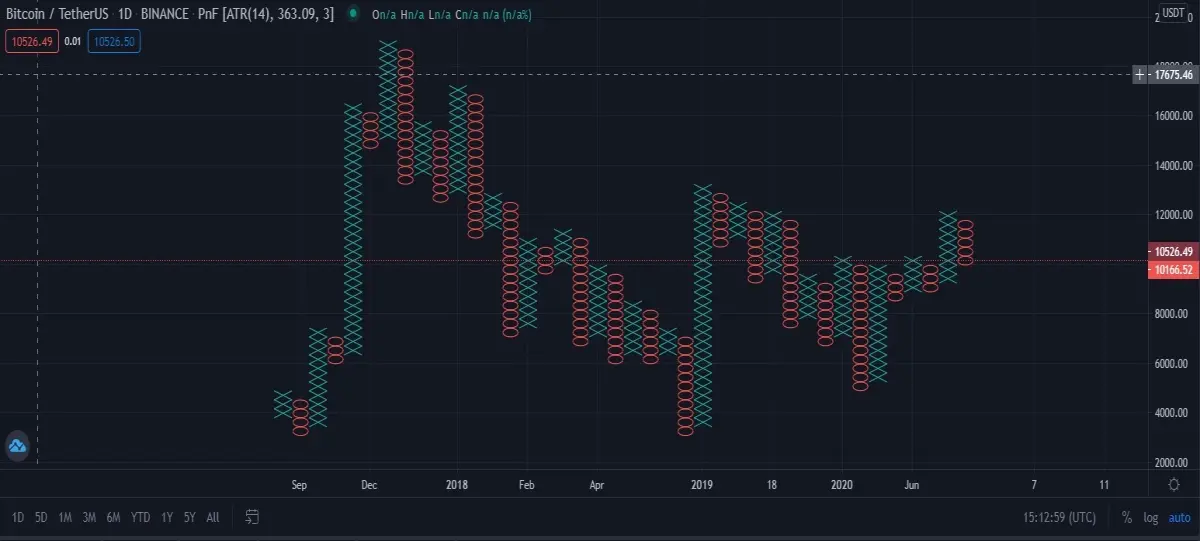
A 'point and figure chart' plots interest, instead of against time, against price reversal. In other words, a "point and figure chart" does not have a time axis, unlike most other maps. A series of 'X's is displayed in a single rising column, corresponding to the price, as long as the price is rising. A new column of 'O's is initiated, immediately to the right, when the price falls. As long as the price drop, this persists downwards. A new column of 'X's is launched as the price increases, instantly to the right again. And so forth. Only if the price direction reversal is at least a specific size (determined by the chartist for that particular chart) will a new column be started.
Thank you for reading and hope you have a good rest of the day!
I also post my content on the following platforms:
Publish0x: https://www.publish0x.com/@aftershock9?a=Vyb82ANmev
Hive: https://hive.blog/@mercurial9
Read.cash: https://read.cash/@merurial9
Uptrennd: https://www.uptrennd.com/user/mercurial9
Steempeak: https://steempeak.com/@mercurial9
Instagram: https://www.instagram.com/minimalistpixel/
Pinterest: https://za.pinterest.com/minimalistpixel/boards/
Twitter: https://twitter.com/minimalistpixel






