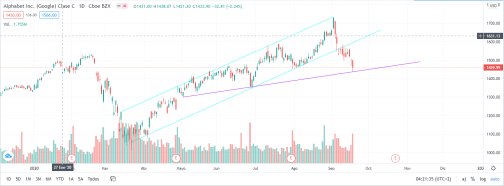
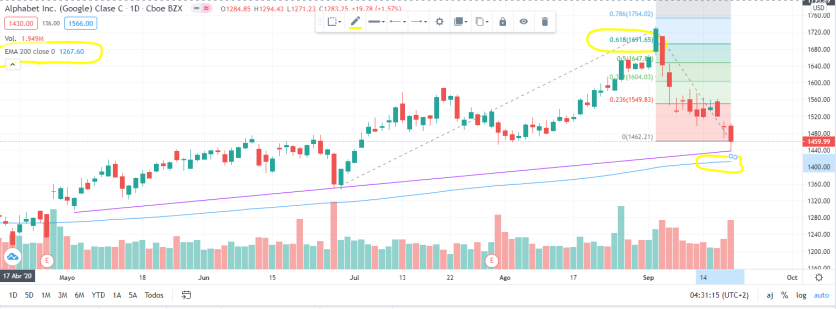
Google breaks its bullish channel (marked with blue lines) to the downside and reaches a double support marked by the violet trend line and the 0.786 Fibonacci.
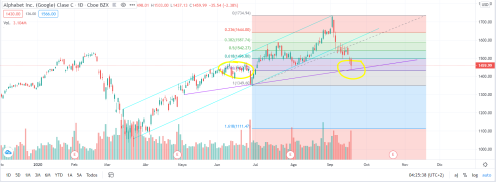
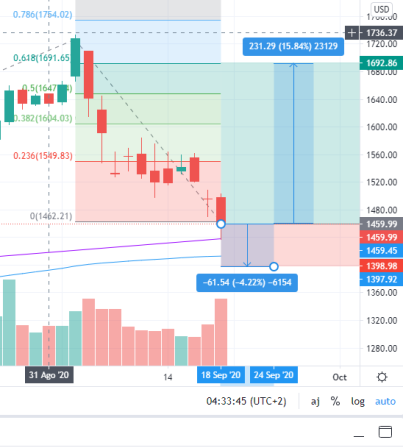
This could indicate a very strong first support for the price to bounce and look for the 0.618 of the Fibonacci extension.
As a second close support we can find the exponential moving average of 200 periods.
It could turn out to be a risk 1, profit 4 entry opportunity. Placing a stop-lose 4% below the current price (level below the 200-period moving average). With a take profit of 16% at 0.618 fibonacci