Hi friends
My analysis and prediction of the Bitcoin currency according to the indicators that I created on the Trending View platform
Bitcoin started an impulse wave to the upside, as I told you in my previous post that it moved to the upside after closing the week and it actually happened. The first target area was 64 thousand in the previous post and then it climbed to the 75 thousand area and now after updating the indicators Bitcoin is heading to the 80 thousand areas
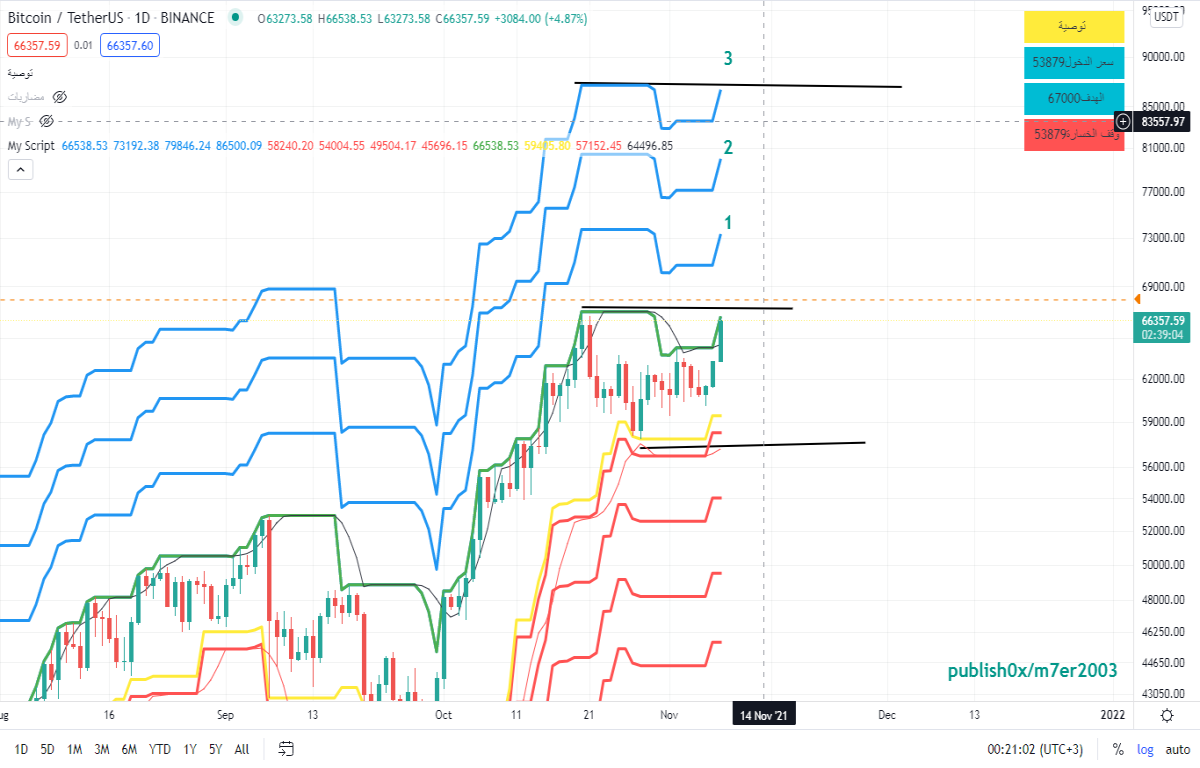
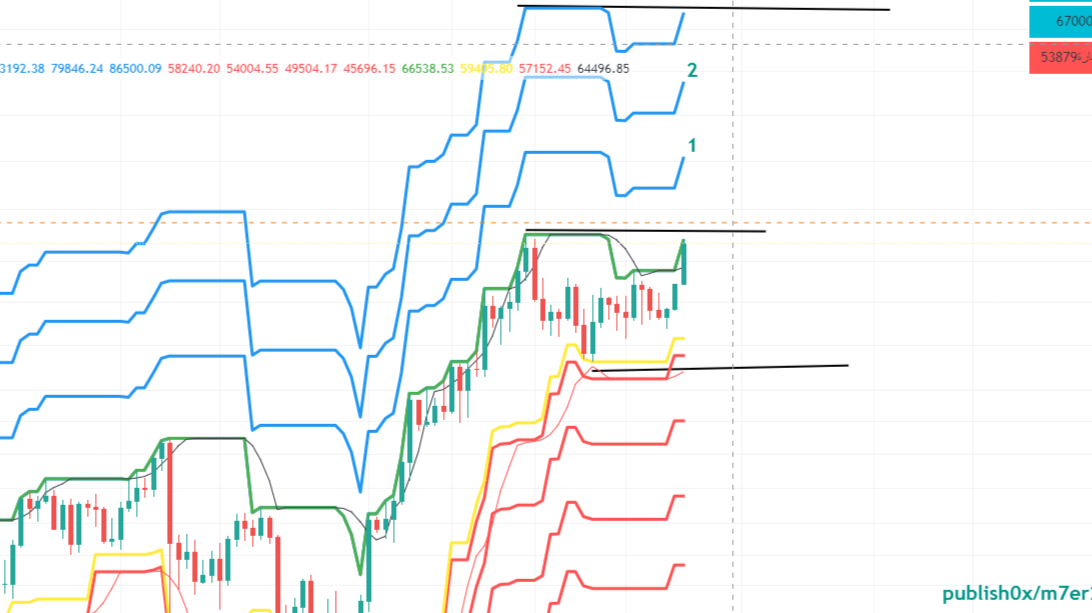
Love this picture. This is an indicator similar to Monte Calo Simulation, but it is slightly different. It depends on a set of supports and resistances, which it collects and enters into a mathematical equation to give me the best entry and exit areas for quick speculation and works on all frames.
The clear line means the best entry area for the spot to buy
And the red line is the best selling exit area from the deal
As for the blue lines, they are medium-term investment goals
Thank you, and don't forget to tell us your comments about my writing