
Dear Readers,
At the time of drafting this article, the global crypto market cap stands at $2.39Trillion, which is a up of 1.69% from yesterday.
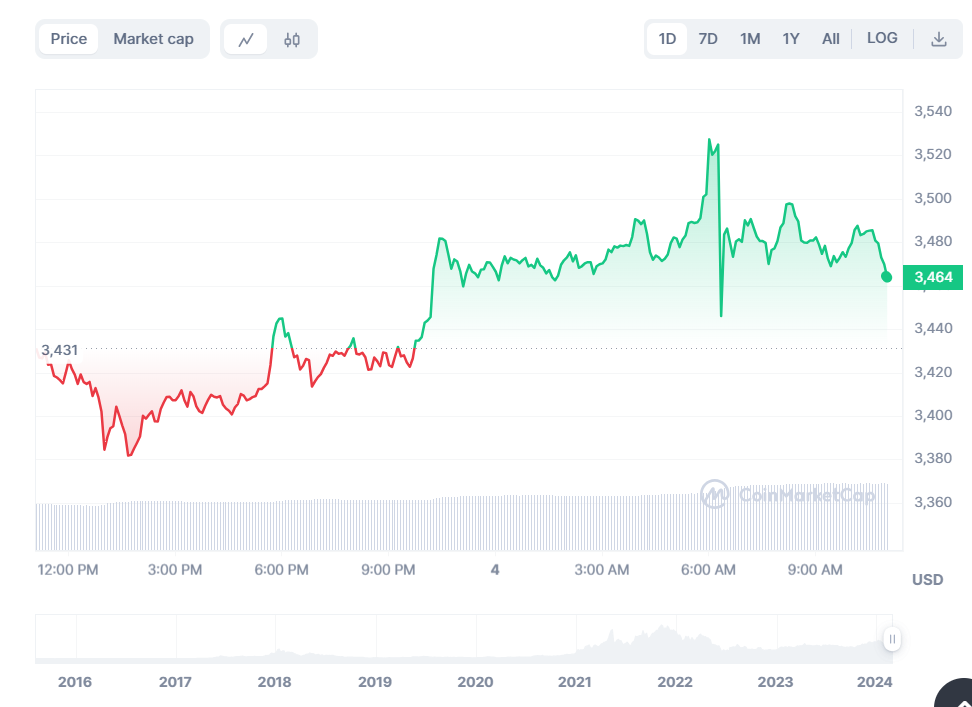
BTC currently trades at $ 63507, a up of 2.52% from yesterday while ETH trades at $ 3472 which is up by 1.08% from yesterday.
As we have done an article on the BTC projected movements yesterday, we will now concentrate on ETH price.
Looking at the technical charts of ETH, ETH is trading at the 100-hourly Simple Moving Average (SMA).
There we would see a key bullish trend line in the hourly chart forming with a support for ETH at $ 4320.
There are higher chances of ETH moving towards $ 3650 and then to $3800 levels.
Moreover, ETH phased up with the important upgrade called the Dencun update.

The Dencun update for ETH would be happening in March 13. We do expect a pump in ETH on this update. We have made an exclusive article on this. Click here to access it if you have missed it earlier.
The Immediate resistance for ETH as of now is at $3,500 levels while the first major resistance is at $3,520 level.
The next major resistance is near $3,550 above which the price might gain bullish momentum.
If it crosses these resistances, the next level for ETH would definitely be at the $3,650 level.
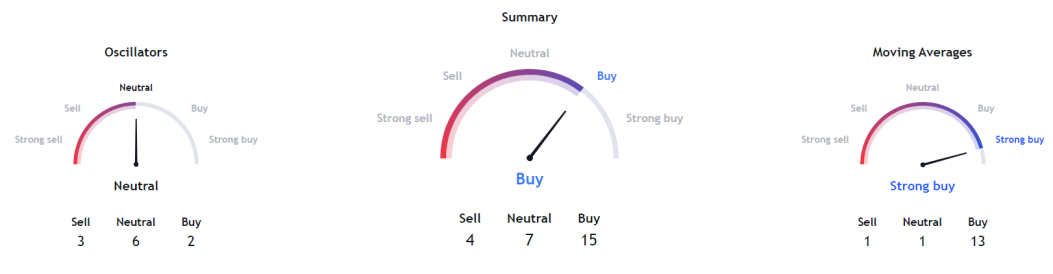
The Key Technical Indicators for ETH are follows:
- Hourly MACD – The MACD for ETH/USD is gaining momentum in the bullish zone at present.
- Hourly RSI – The RSI for ETH/USD is now above the 50 level.
- Major Support Level – $3,400
- Major Resistance Level – $3,520
If we take the major technicals for ETH, all that shows strong signs of bullishness.
There seems to be all good times for the cryptomarkets ahead.
There are two major events scheduled during this month CPR Data for February and FOMC meeting that may drift the cryptomovements.
Let's hope these would turn positive too.


