
KCS - An Overview
KCS is the native token of KuCoin, which was launched back in 2017 as a utility token that allows traders to share the growth benefit of the exchange. The total supply of KCS was set at 200 million, and there is a planned buyback and burn until 100 million KCS remain.
Where To Buy KCS?
KuCoin is the biggest market for KCS with a daily average volume of 20 million. The liquidity of KCS keeps improving, as KCS has been listed on exchanges including KuCoin, MXC, Poloniex, AscendEX (formerly Bitmax), and Probit.
KCS Price History & Technical Analysis - Should You Buy?
Starting from humble beginnings from a price of only $0.34 in 2019, the KCS token spiked in 2021 so much that it left behind every major CEX token, including the BNB - the coin owned by Binance, the world’s largest cryptocurrency exchange. The chart below shows the steady rise of KCS in March 2021 and a meteoric difference in April where it went up to 2500%. The dump that happened in May 2021 caused it to come down, however, all CEX showed the same behavior in that bearish market.
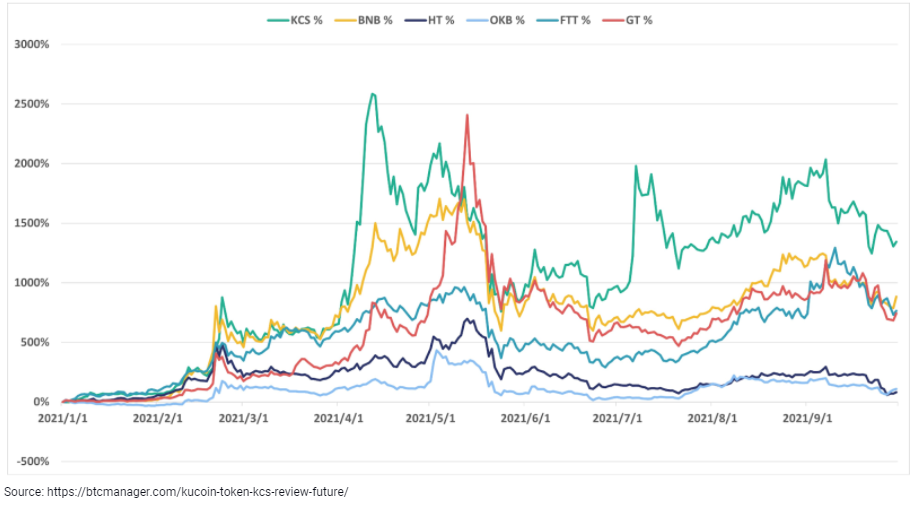
If you zoom out the KCS 1-D chart, you will see that it is one of the few high-performing tokens of 2021 that came early, spiked, went down in the bear market of May 2021, and later broke the all-time high.

Source: Tradingview
The KCS token is currently going strong in the $26 range, after hitting its all-time high of $27.73 a few days ago. The rallying of the KCS token started in the $9.5 range where it had a very strong support area. It bounced from $9.5 and almost doubled its price as it reached the $18 mark. From there on, the chart moved horizontally and another two massive green candles took the KCS token to its all-time high of $27.73.
What Do The Technical Indicators Show Right Now?
MA 50/200
The moving average 50 and 200 line shows the indication of a golden cross and a bear cross. It is a great indicator to take a long or short position in any crypto project.
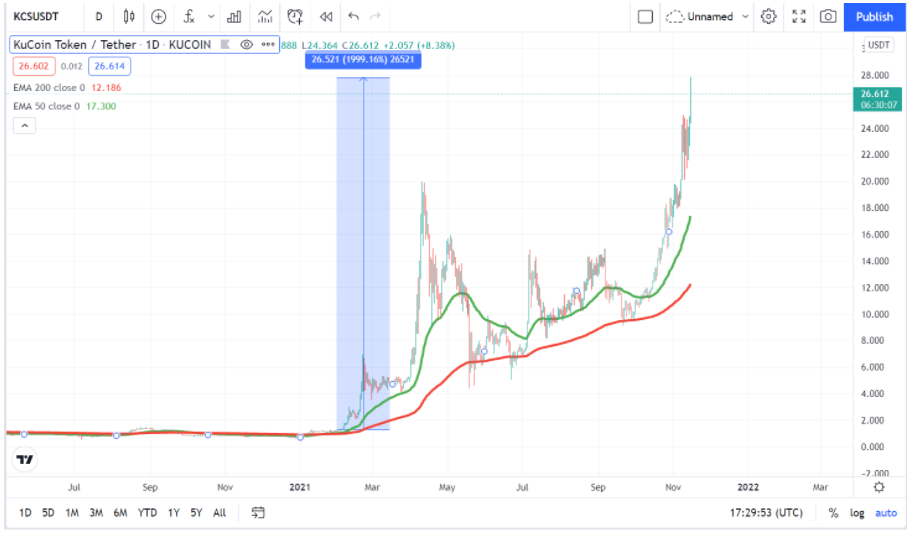
Source: Tradingview
In the case of the KCS token, the MA 50/200 lines show a clear indication of a golden cross. The golden cross of KCS was so powerful that after it was formed in the $1.3-5 range it always remained there. Meaning the green line of MA 50 crossed the red line of MA 200 and took the price of the KCS token with it to the skies. Even the bearish market of May couldn’t transform this golden cross into a bullish cross. This is a clear indication that the KCS token has a very strong backbone and it is a CEX token to look out for in the upcoming months.
Relative Strength Index (RSI)
RSI is one of the strongest and most respected signals in the world of financial markets.
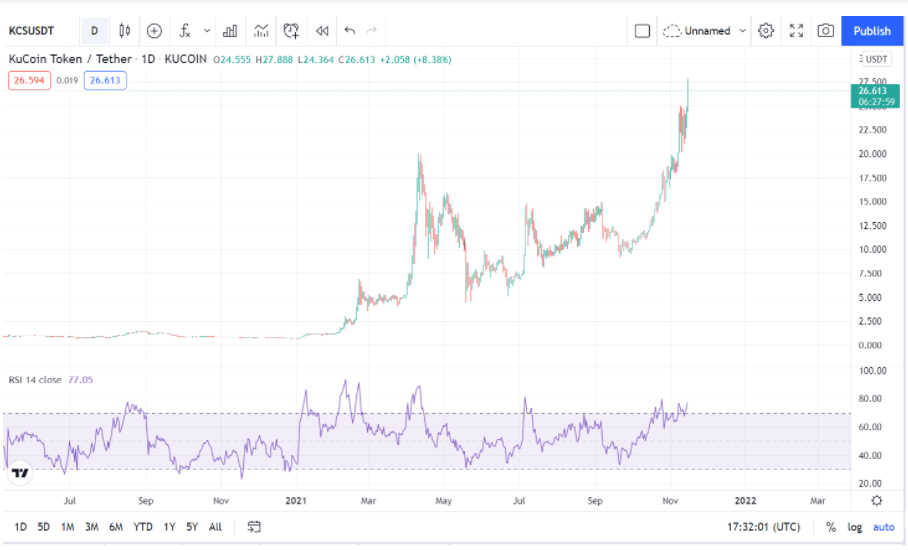
Source: Tradingview
When it comes to KCS, the curious story unfolds in front of our eyes, which is that the RSI has never gone down below RSI 30, which is considered a very low point for any crypto project. The bear run of the crypto market in May did bring it close to that mark, however, it recovered extremely well.
Not only did the RSI 30 point remain untouched, in addition to that the RSI chart shows several breaks of the KCS tokens over the RSI 70 which indicates a bullish run of the token. At the moment, RSI has broken the 70 mark which explains why KCS continues to break its all-time high. Crypto experts don’t recommend an entry at this point, however, seeing that the KCS token has shown consolidation of RSI (very often) and breaking out of the RSI 70 level multiple times in the past, an exception can be made. Overall, the RSI indicator signs are good, and despite a crash from $25 to the $21 range (not long ago).
Chaikin Money Flow (CMF)
The CMF indicator is an underrated indicator, however, it is one of the best ones to take a long-term position in many projects.

Source: Tradingview
In the case of the KCS token, the CMF indicator is way above the 0.00 blue line, which means that volume and price accumulation are going on an uptrend for a long-time in this project. Although the CMF token might be coming down (mostly) in the downward direction, the distance from the 0.00 line is very far. This may also be a buying indicator for traders who like to buy a coin in short dips, popularly known as the Dollar-cost averaging (DCA) investment strategy. CMF is also an indicator to show that in the near future, the KCS trend is in the upward direction, as the current red-candle scenario is caused by the fall of Bitcoin (BTC) from its $69k all-time high.
So, should you buy the KCS token right now?
Well, in our personal opinion, the KCS token is a buy due to two main reasons. Firstly, the volume in KCS is coming like never before and secondly, the chart is moving horizontally, and if we go by the price history of KCS, a breakout is coming very soon.
Please note, that this analysis is done at this time and readers must do their own research before taking a position into the KCS token.


