
Following the announcement of Steemit ditching EOS in favor of TRON, many people expected the TRX price to rise. So far, there is a minor gain on the day, yet there is still plenty of room for future growth.
TRON Price Moves up Again
This past week has seen plenty of TRON price momentum. Following a steep dip on February 13th, the uptrend has been trying to resume. With plenty of ups and downs along the way, the overall momentum seemingly remains intact.
As is often the case with TRX, there's ample trading volume. More volume can often yield more volatility, both for better or worse. TRX/USDT are the primary trading pairs today, yet one should never overlook TRX/BTC. Sistemkoin's TRX/TRY pair is also contributing a lot of volume, which is good to see.
TRX/USDT Technical Indicators

Bollinger Bands: Numerous candles in a row tend to create widening Bollinger Bands. On the TRX/USDT chart, the gaping maw is clearly visible. This is a clear sign of healthy liquidity, but can also trigger severe volatility. That volatility can go both ways, thus it is a market well worth keeping an eye on.
Moving Averages: The MA20 keeps creeping up, indicating the overall upward trend is still strong. With the recent bullish cross between the MA50 and MA200, there is a lot of genuine excitement. The MA200 is flattening a bit, similar to what is happening to Basic Attention Token. That can be a core indicator for the near future.
RSI: Being in overbought territory is almost becoming a meme for crypto assets these days. Although this territory cannot be sustained indefinitely, there is zero reason for major concern at this time. Everything stands and falls with Bitcoin, however, thus caution remains advised.
Resistance Levels: While there are a lot of resistance levels on the chart above, they are all in close proximity to one another. For now, core resistance levels are found near $0.02678 and $0.02738. It seems unlikely that $0.02637 will play a big role of importance, although it may result in a temporary volatility level.
TRX/BTC Technical Indicators
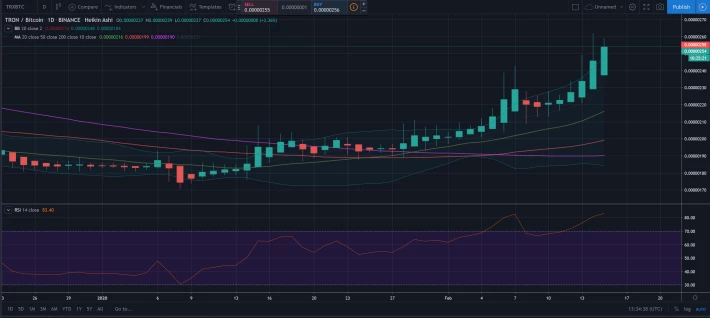
Bollinger Bands: The TRX/BTC Bollinger Bands are looking very healthy as well. There is ample "spread", but it too indicates a potential increase in short-term volatility. For now, the candle "bodies" are far bigger than the wicks, thus no immediate trend reversal will occur. A period of accumulation can kick in at any given time, however.
Moving Averages: The moving averages for TRX/BTC are as bullish as those for TRX/USDT. The MA20 and MA50 are moving up rather nicely. As far as the MA200 is concerned, it isn't budging all that much, which is not of too great concern right now. Everything hints at a continuation of the uptrend, albeit it will be slow-going.
RSI: Even TRX/BTC is currently in overbought RSI territory. That just goes to show how much all currencies are moving up in quick succession. This RSI has an angle that continues to slope up, which is very interesting to keep an eye on.
Resistance Levels: The current level at 255 Satoshi is a minor resistance of its own accord. Further up is 274 Satoshi, which may be a slightly tougher nut to crack. Reaching the real "test" at 403 Satoshi will require a lot of work, and may not materialize for some weeks to come.






