
A lot of people closely monitor the Bitcoin price this weekend. The sudden drop has caused a lot of concerns, even though this small retrace was entirely to be expected.
Bitcoin Price Dips Slightly
It has been a very bullish month for the Bitcoin price. Solid gains have been noted between $8,200 and $10,300 in very quick succession. A sudden drop by a few hundred Dollars is to be expected after such a stretch. Bitcoin is still up by nearly 10% in the past 30 days, after all.
What is remarkable is how Bitcoin is primarily traded against stablecoins. Four out of the top 5 pairs are BTC/USDT. The only exception is BTC/USDC on Bitmart. There is ample liquidity with nearly $16.9 billion in volume, but the bears will remain in control for today.
BTC/USDT Technical Indicators
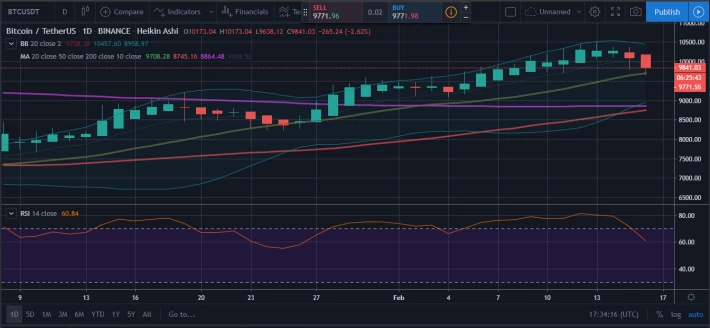
Bollinger Bands: Following this recent Bitcoin price dip, the Bollinger Bands show clear signs of narrowing. That often signals a pause until the next move happens. For now, no one knows for sure if that will be a move up or further down. Given the rejection near the 38.2.% Fib, a complete trend reversal remains plausible.
Moving Averages: All in all, the MAs on the daily Bitcoin price chart look healthy. The MA20 is still moving higher. In the next 48 hours, the MA50 should perform a cross with the MA200. This all seems to confirm that no major reversal will occur, but the red candles are growing larger.
RSI: After an extended stay in overbought territory, the Bitcoin RSI has now returned to the neutral levels. This is not necessarily a sign of an ongoing bearish trend. It is still too early to draw real conclusions in this regard.
Fibonacci Retracements (BTC/USD): This is where the situation gets a bit interesting. In June of 2019, the Bitcoin price got rejected near the 50% Fib, pushing the price down to the high $6,900 range. This time, the rejection occurred at the 38.2% Fib.

For all intents and purposes, this seems to confirm that the uptrend may be broken once again. It is the third time that this level comes into play, without much success. At the same time, this may be the last retrace before breaking the 50% Fib at $11,594. The coming days will tell more about where the market may be headed next.
Resistance Levels: It would appear that the $9,934 level may act as a resistance level for the coming few days. Further up, there will be some pushback near $10,290, a level that has proven very difficult to break.
The role of importance of the $9,679 remains unclear as well. It should be a support level, but it may become a resistance zone as well. Per the lack of a strong market signal, it is anyone's guess as to what happens next week.






