
Ethereum's been raising some eyebrows over the past month while adding 50% to its value. Let's check in on the 1H chart and notice the back to back W formations that sent Ether into price discovery.

I thought it might be interesting to pull back and look at the larger pattern. Here is the 1D for Ether.
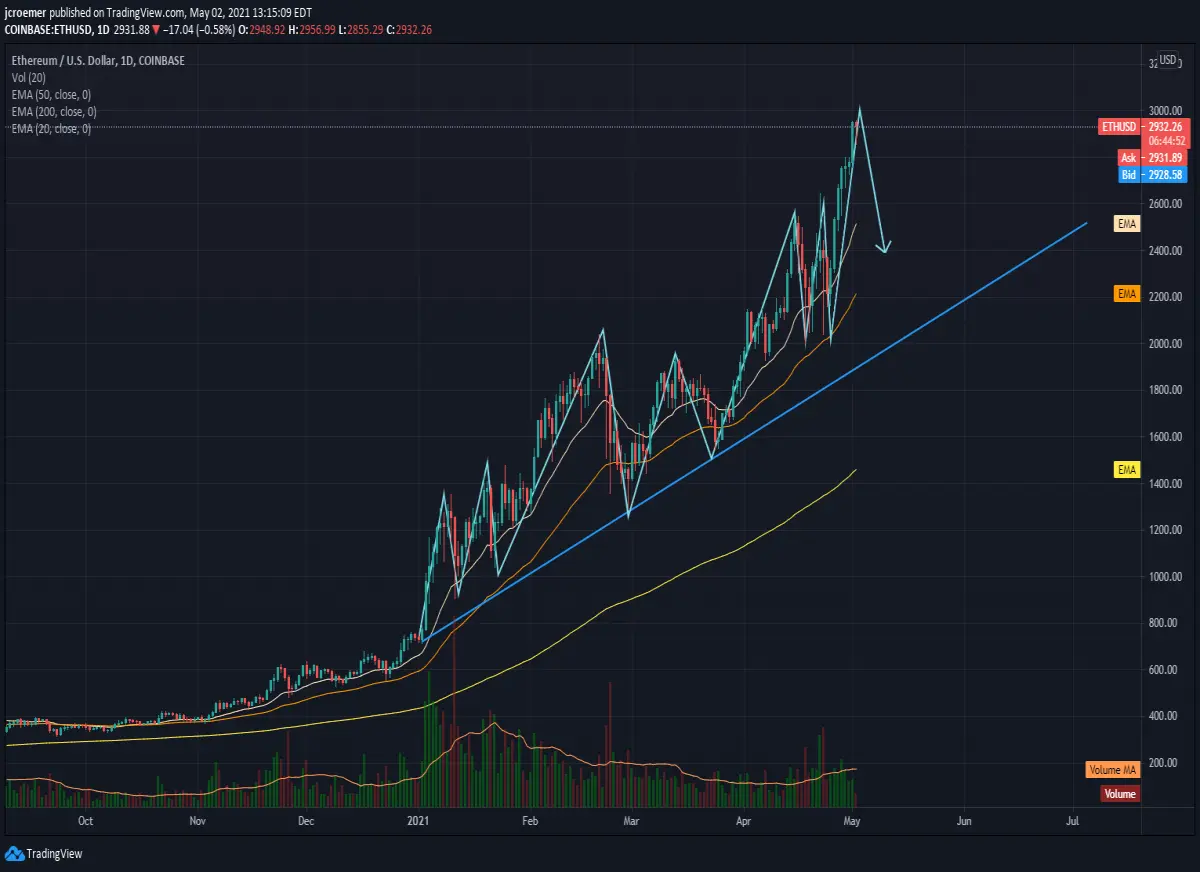
Notice that price has moved well above the 50-day and the 20-day EMAs so we have to expect that the market will come back to test those levels in the near-term. The 20-day sits at 2515.84 and the 50-day down at 2214.83. Although, Ether has not spent much time around it's 50-day EMA this year whatsoever. The trend line above starts Jan 1, 2021.
The market is begging new traders to FOMO in. Nothing moves up in a straight line. However, it's still just below overbought territory for a bull market (I'm arguing that 90+ is overbought in a crypto bull market) which is where Ether was in the early months of 2021:
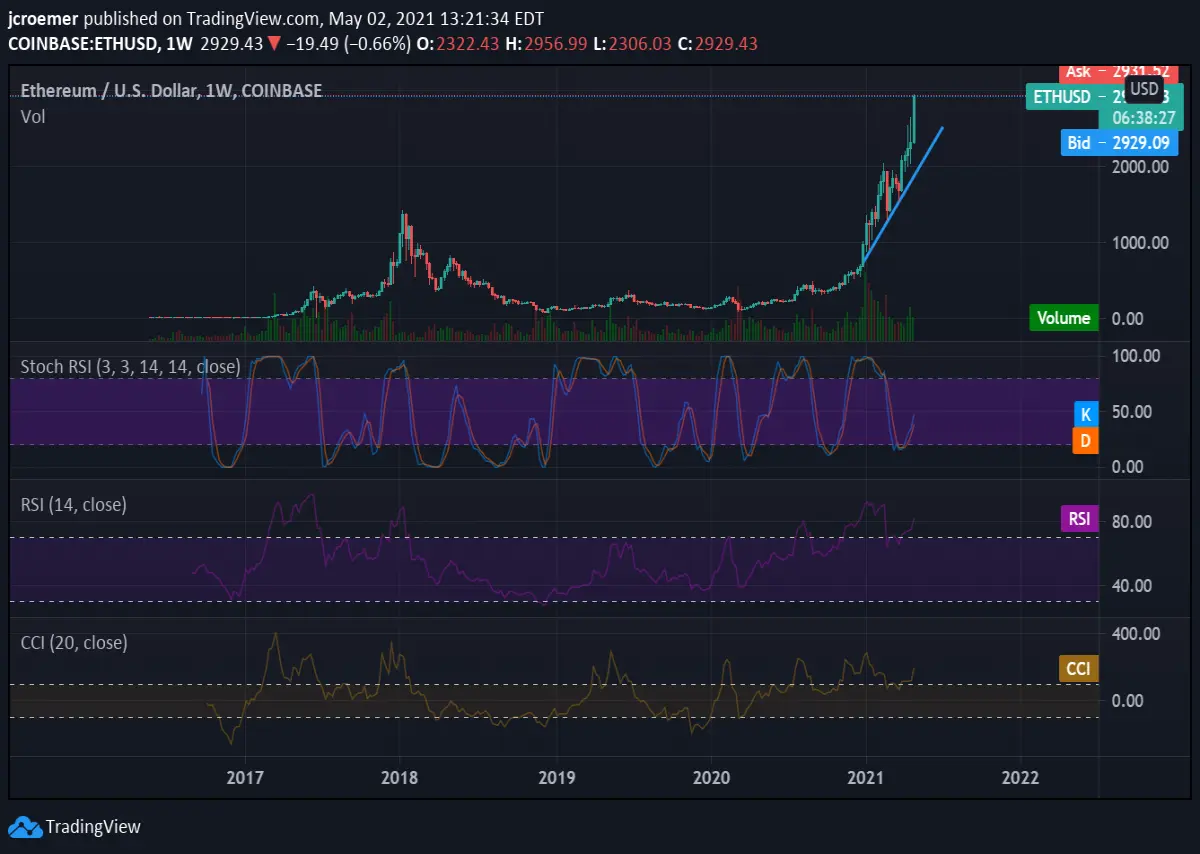
We should expect some correction and consolidation in the near-term, but Ether is showing us why many picked it to outperform Bitcoin in 2021.






