
Around the end of December, the Synthetix Network token (SNX) printed a red Heikin Ashi candle on the weekly chart for the first time, after 20 green candles. This marked the beginning of a correction for the token that was in an unstoppable rally.
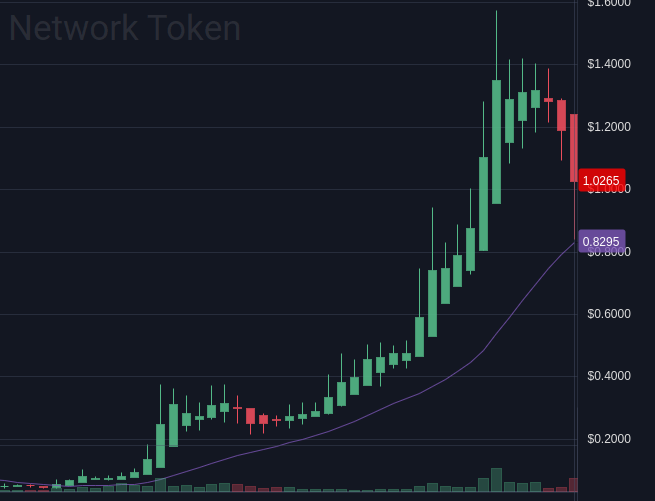
SNX weekly chart, Heikin Ashi
On January 6th, on the daily chart, SNX just broke down of a very clear descending triangle pattern, which is a bearish pattern.
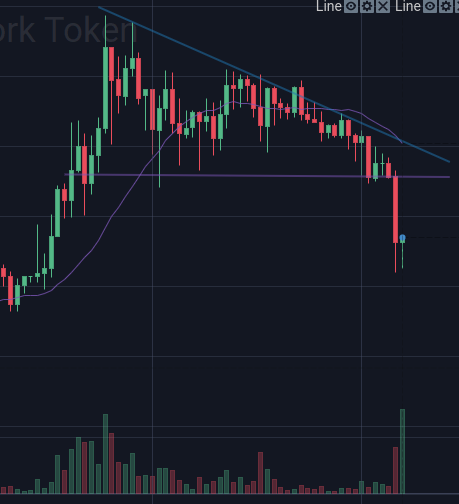
SNX descending triangle on daily chart
After that, the coin, that had been holding well the $1.20 level, fell massively to around $0.84 and now is showing a small short-term recovery to $0.94. The recovery might continue, but there will be strong resistance at the previous support around the levels of $1.10-1.20.
Looking at the weekly chart, we see that the price was supported perfectly by the 20-day simple moving average. However, the weekly MACD is just about to make a bearish cross, which have not been seen yet, and in my opinion is a very strong bearish signal.
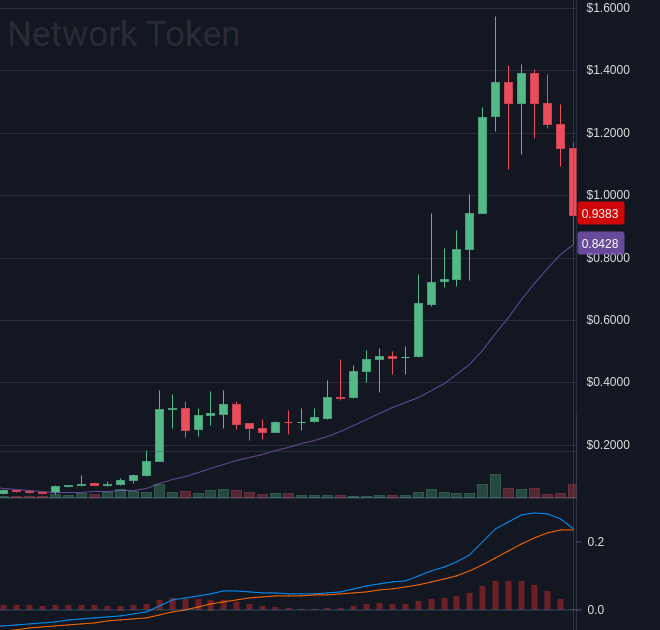
SNX weekly chart and bearish MACD
The Synthetix project has strong fundamentals and I think it has great investment potential in the long term. It's current market cap of around $145mi is ridiculously small, so a growth of 2x, 5x or even 10x in the next years would not be surprising. For the moment, however, it seems that we are just entering a correction phase. Given the behavior of crypto markets, I would expect a 40 to 60% correction, especially in this case that we had such a massive bull run. That would put SNX price anywhere around 62 to 94 cents. This bear market will also be an interesting test for the project as a whole, since they have not seen a big drop in value since the project entered the top 100.


