
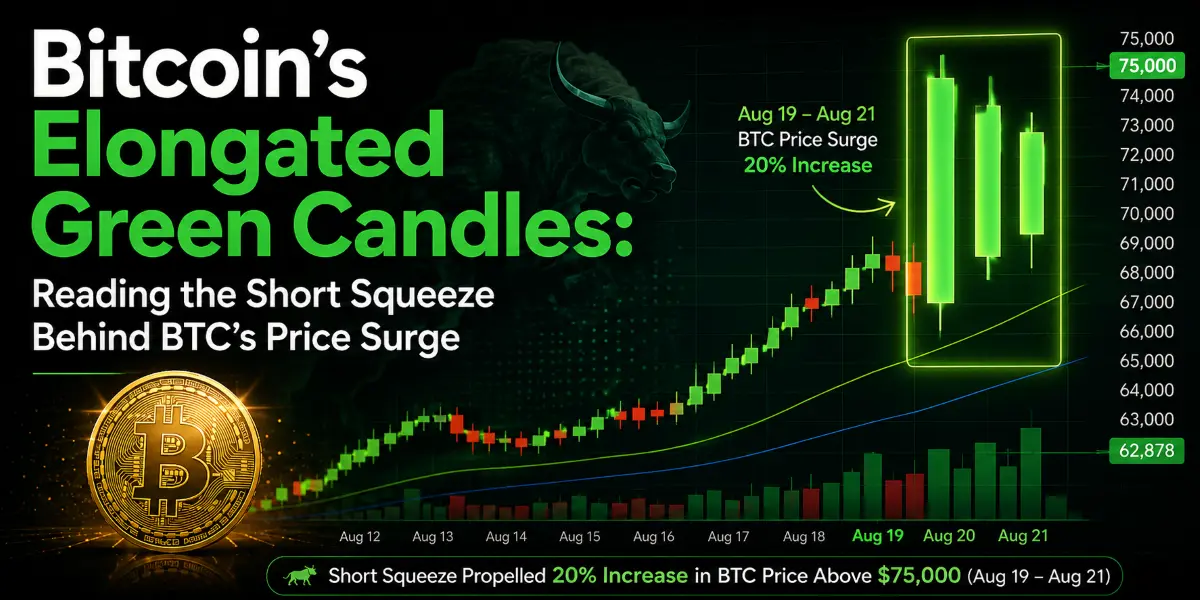
ChatGPT-generated image.BTC’s 20% climb in price due to the short-squeeze effect!
Short-Squeeze Phenomenon Reflected in BTC’s Elongated Candle Pattern
BTC price has moved upward with an elongated green candle for the third consecutive day.
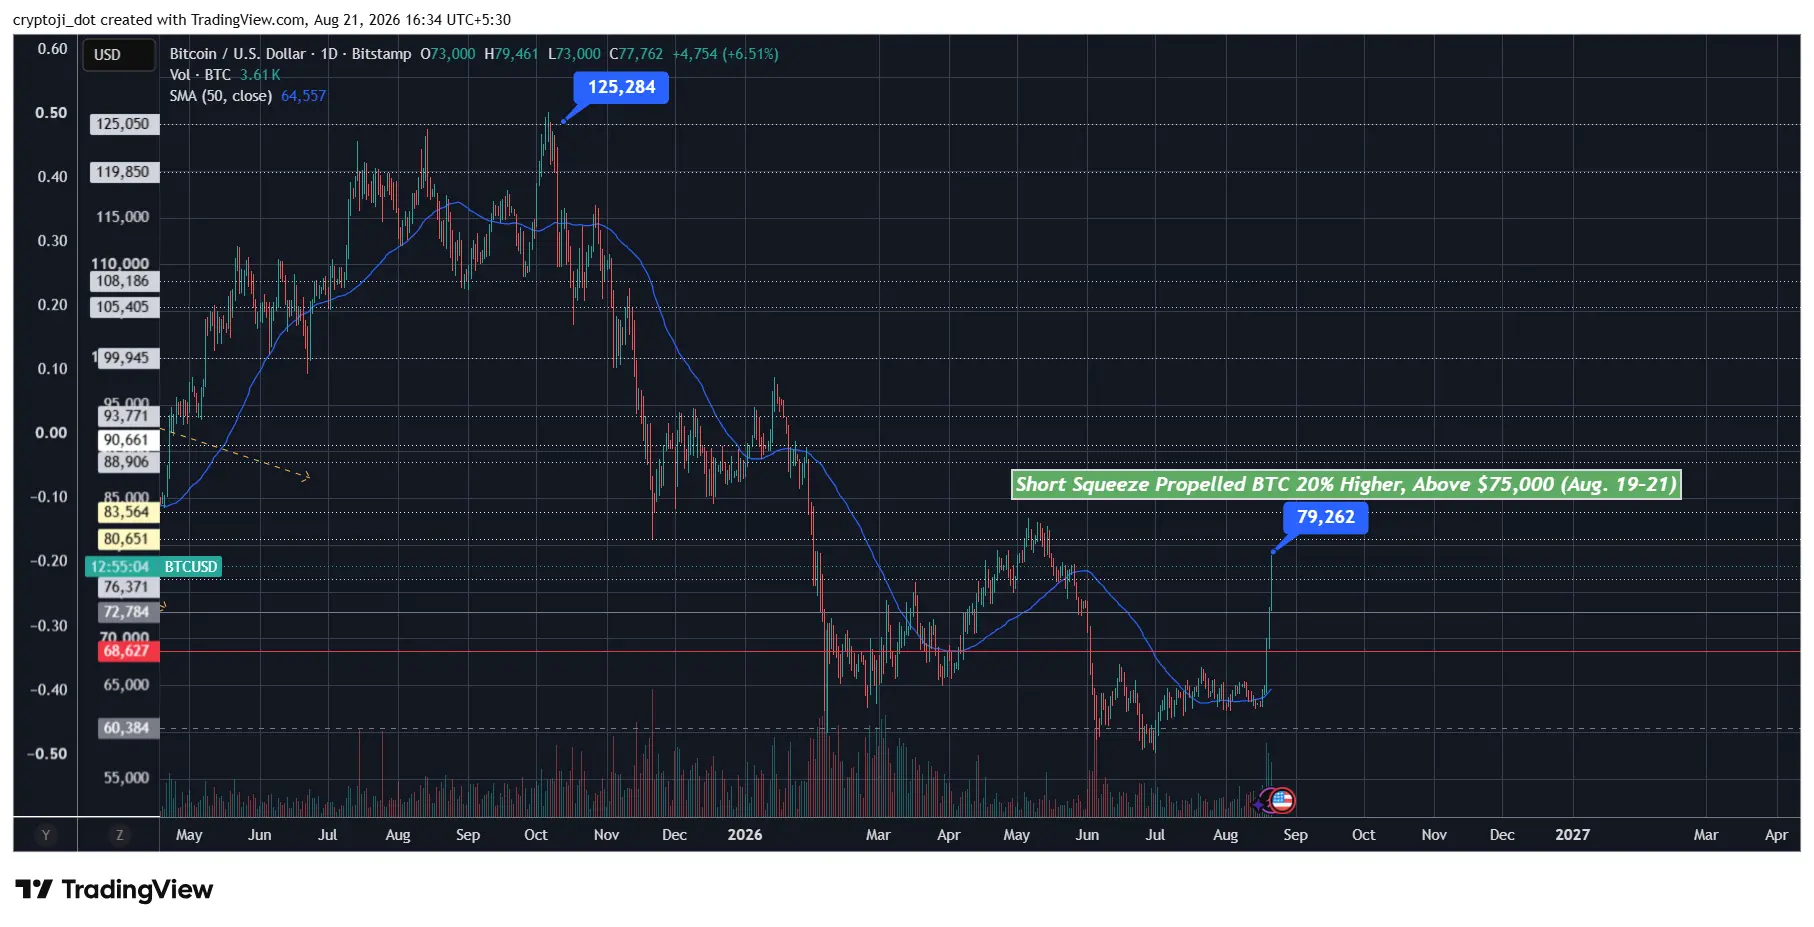
Since August 19, BTC’s price has risen by approximately 20%, from $63,878 to $77,256 at the time of writing.
A major milestone was BTC surpassing the $70,000 range on August 19.
However, BTC’s elongated candles tell the story of a short-squeeze event that I discussed in yesterday’s article:
Bitcoin’s Elongated Green Candles: Reading the Short Squeeze Behind BTC’s Price Surge
BTC’s Initial Price Rise Before It Triggered a Short Squeeze
What happened first was that BTC’s price increased following several developments.
First, President Trump indicated support for building the U.S. Strategic Bitcoin Reserve through additional Bitcoin purchases. Until now, the reserve was primarily structured around BTC already seized by U.S. authorities, including Bitcoin recovered from criminal activity.
Second, the U.S. Treasury announced plans to increase its purchases of long-term U.S. debt through buyback operations of up to **$4 billion per operation**. The announcement pushed long-term Treasury yields lower and was interpreted by markets as supportive of risk assets, including Bitcoin.
Third, market expectations of an immediate U.S. Federal Reserve interest-rate hike declined.
These developments helped create the initial upward momentum in BTC’s price.
Price Amplification of BTC Due to the Short-Squeeze Effect
As BTC’s price increased, leveraged short positions began to be liquidated.
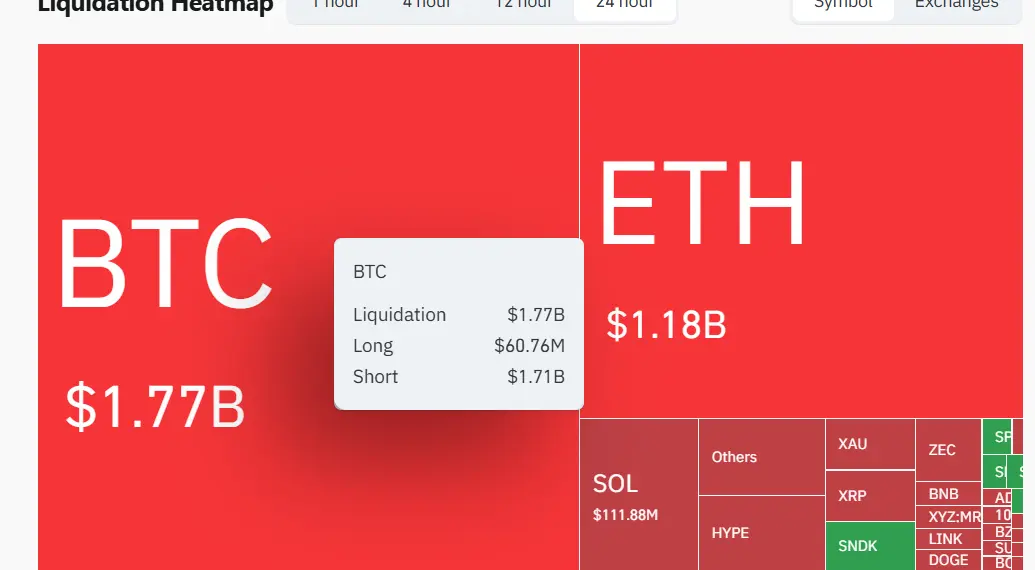
CoinGlass. 1.74$ B worth of BTC liquidated in Short Positions.
Traders who enter a short position typically borrow BTC and sell it, expecting to buy it back later at a lower price and return the borrowed BTC. Their profit comes from the difference between the higher selling price and the lower repurchase price.
However, when BTC’s price rises instead of falling, short traders incur losses. With leveraged positions, a sufficiently large price increase can trigger liquidation.
When these positions are liquidated, the traders are effectively forced to **buy BTC back at higher prices**.
This creates additional buying pressure.
The resulting increase in BTC buying can amplify the upward price movement, creating a **short squeeze**.
This short-squeeze effect is visible in BTC’s price chart through the unusually elongated green candles.
Short-Squeeze Driven Price Increase Diminishing Day by Day
But look at the three green candles.
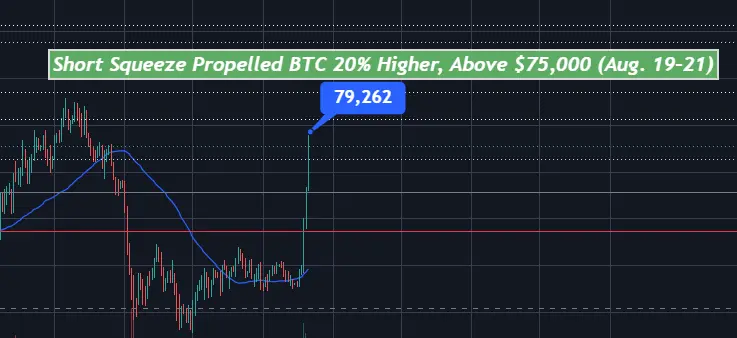
This is where Bitcoin’s price chart becomes particularly interesting.
BTC produced elongated green candles on **August 19, August 20 and August 21**.
But they are not identical.
The August 19 candle is the longest.
The August 20 candle remains strongly elongated, but is smaller.
And the August 21 candle is elongated again, but smaller than the previous two.
This gradual reduction in candle size could indicate that the short-squeeze effect is losing intensity.
The logic is relatively straightforward.
As BTC rises, more short positions can be liquidated, generating forced buying. But once vulnerable short positions have already been removed from the market, there are progressively fewer shorts left to liquidate.
Therefore, the forced buying generated by the squeeze can begin to diminish.
The three-day candle sequence could therefore be read as:
August 19 → strongest short-squeeze pressure
August 20 → continued short covering, but reduced intensity
August 21 → continued upward pressure, but another reduction in candle size
This does not mean that the short squeeze has necessarily ended. Additional short positions can continue to be liquidated as Bitcoin reaches higher price levels. The rally has, in fact, continued alongside further short liquidations.
However, the declining size of the successive green candles suggests that the marginal force supplied by forced short covering may be weakening.
The next question is therefore what happens when the short squeeze loses its momentum.
Can genuine BTC demand support the price above $70,000 once the forced buying from liquidated short positions diminishes?
That is what I will be watching next.
Also Published on
InLeo|Medium|Substack|LinkedIn






