
Since breaking out at the end of November, the Zilliqa (ZIL) price proceeded to increase by nearly 150%.
While Zilliqa has been rejected from the highs, it is expected to reverse its trend and resume its upward movement.
Zilliqa Long-Term Levels
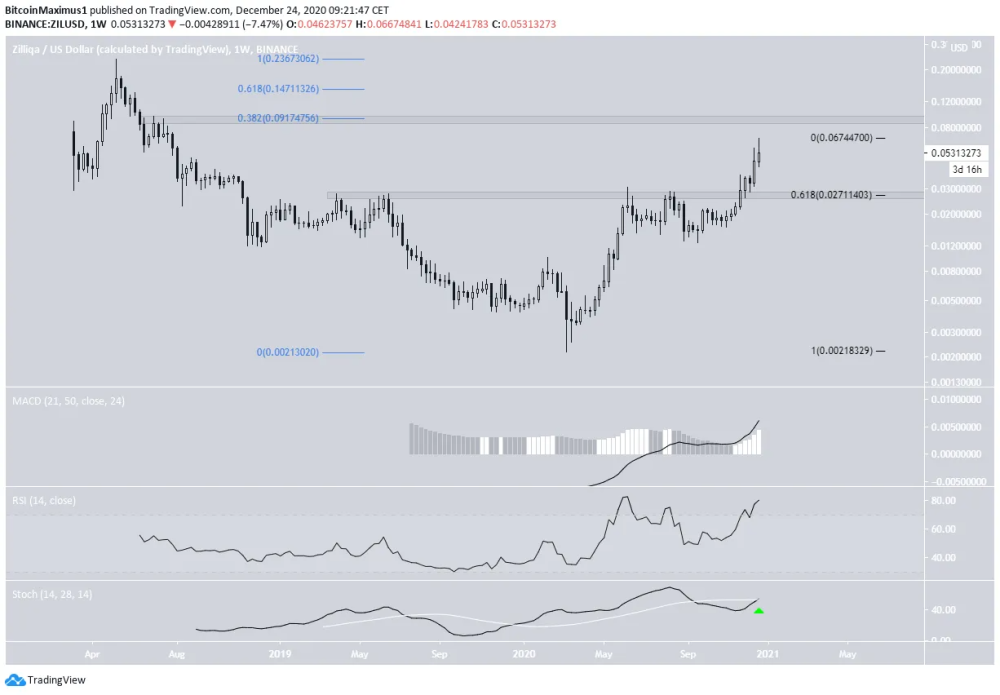
The weekly chart shows that ZIL has broken out above the $0.027 long-term resistance area near the end of November. Since then, ZIL has increased considerably to reach a high of $0.066.
The next closest resistance area is found at $0.091 (0.382 Fib retracement level).
Conversely, the support area is found at $0.027, This is both the breakout level and the 0.618 Fib retracement level (black) of the upward movement so far.
Technical indicators are bullish, supporting the continuation of the upward move, especially considering the Stochastic oscillator has just made a bullish cross.
The logarithmic chart is used in the chart below in order to better visualize large price fluctuations.
Current Movement
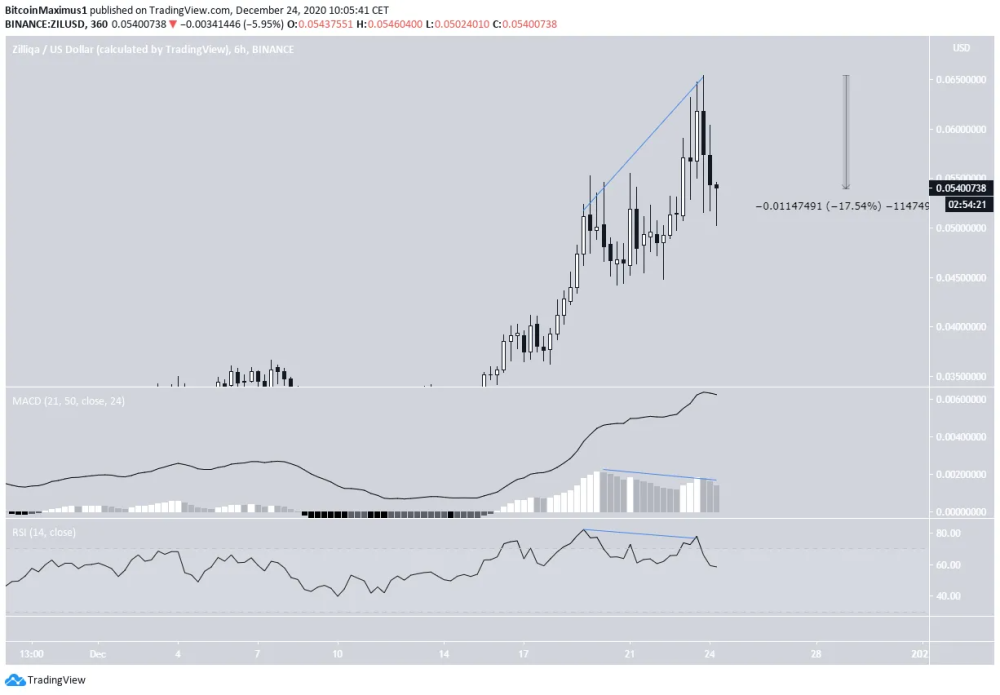
Lower time-frames for ZIL show a significant bearish divergence in both the RSI and MACD during the aforementioned $0.0667 high. However, a significant drop has already occurred as a result of the divergence.
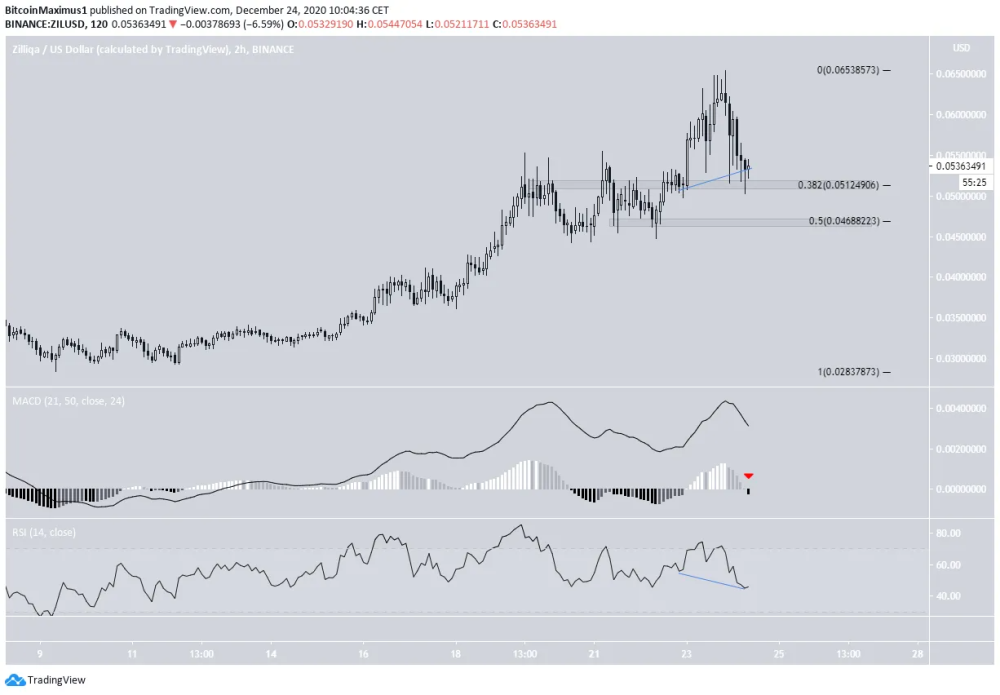
The two-hour chart shows that ZIL is trading at support near $0.051. The next lower support is found at $0.046.
While the MACD has turned negative, the RSI has generated a hidden bullish divergence. This suggests that ZIL is expected to reverse its trend soon and continue moving higher.
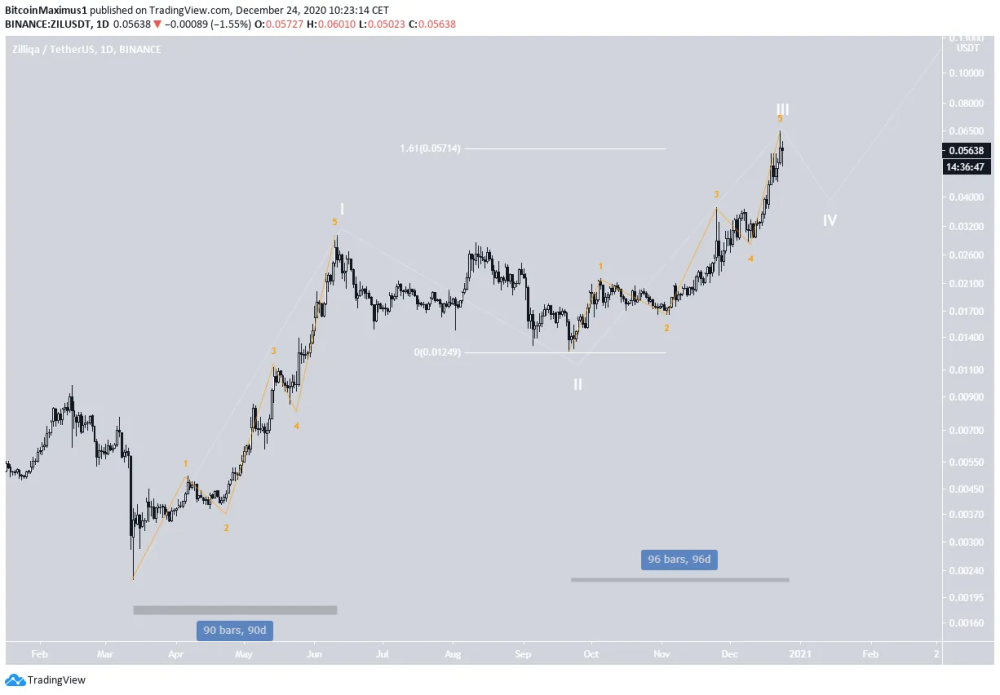
ZIL Wave Count
The main reason for this is the similar lengths of time between waves 1 and 3, and also the fact that they have a 1:1.61 ratio. This ratio is very common in bullish impulses.
Therefore, while ZIL is still expected to move upwards after completing wave 4, the high for the top of the move is likely to be closer to $0.115 rather than $1 as presented in the tweet.
The sub-wave count is shown below in orange.
Conclusion
While Zilliqa is expected to bounce from the current support area, it’s likely still mired in a medium-term correction.
Where do you think ZIL is going? Leave a comment below!
Also, If you are interested in trading, I would suggest you try out BeInCrypto's free Telegram chat. I am there and it is growing very quickly (over 10,200 members) where they discuss the market and share interesting content. They also have a free premium channel where they have a cryptocurrency trading course and daily trading signals. If you are interested, you can click here.
Until next time, stay classy crypto world!


