
The prices of both Yearn.Finance (YFI) and DFI.Money (YFII) have been increasing since Nov 5.
While the former has already flipped an important resistance area, the latter is still struggling to break out.
YFII Trading Range
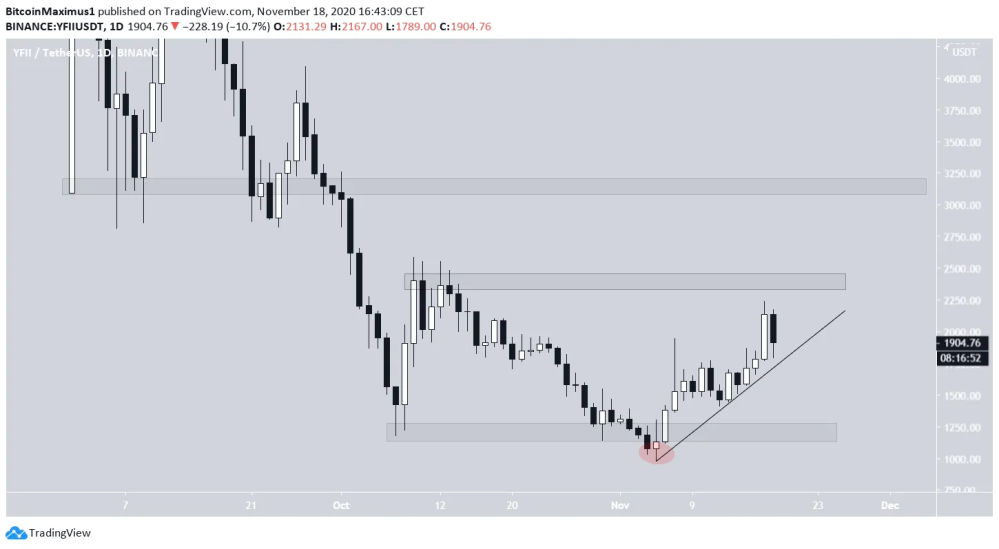
Since Oct 7, the YFII price has been trading in a range between $1,200-$2,500.
On Nov 5, the price deviated below the range low (shown in the red circle) only to reclaim it shortly afterward and resume its upward movement.
At the time of press, YFII is trading for $2,020 and looks to be following an ascending support line in the process.
YFII Future Movement
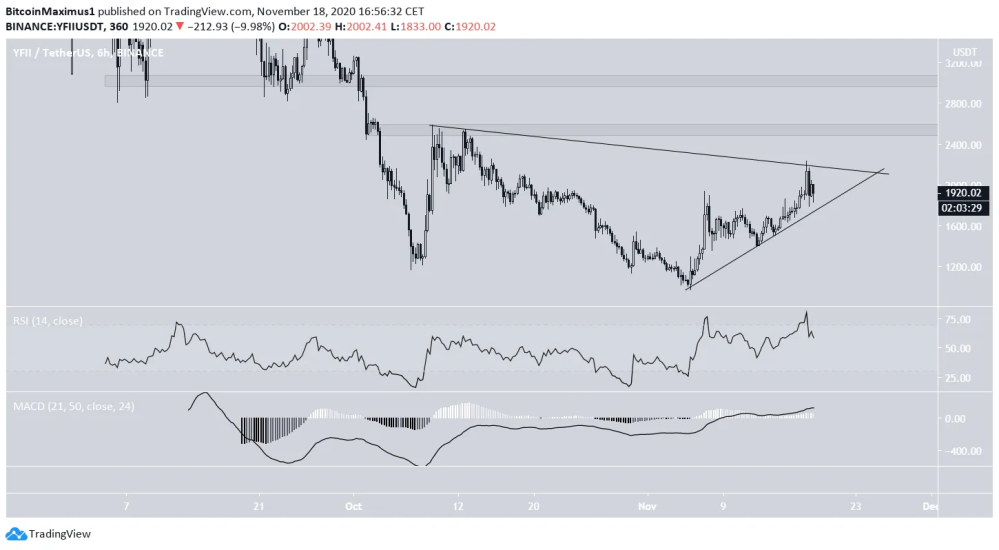
A closer look reveals that YFII may be following a descending resistance line, which creates a symmetrical triangle when combined with the aforementioned ascending support line.
Technical indicators do not yet show any weakness, indicating that the price could resume its upward movement and break out.
A breakout could take the price towards the $2,500 area and possibly the long-term resistance at $2,900.
A breakdown from the ascending support line would invalidate this possibility.
YFI Breakout
Even though both YFII and YFI have been increasing since Nov 5, the latter has already broken out above the main resistance area at $21,000 and is in the process of validating it as support.
If the price continues increasing, the next resistance area would be found at $26,000.
Technical indicators are bullish and support the possibility of this increase.

The shorter-term two-hour chart shows that the price is trading inside a parallel ascending channel. At the time of press, it was trading in the upper portion of the channel.
A breakout above the resistance line would likely take the price to $26,000, while a breakdown from the channel could mean that the rally has ended.

Conclusion
While the direction of the trend is not certain for either YFI or YFII, a break out/down from their current structures will likely play a big role in determining their trajectory.
What do you think we will see in the coming week / month? Do you agree with the above analysis? Also If you like this content, consider tipping the article / following me, so more people see this content and we get a nice discussion going on.
Also, If you are interested in trading, I would suggest you try out BeInCrypto's free Telegram chat. I am there and it is growing very quickly (over 8,700 members) where they discuss the market and share interesting content. They also have a free premium channel where they have a cryptocurrency trading course and daily trading signals. If you are interested, you can click here.
Until next time, stay classy crypto world!


