
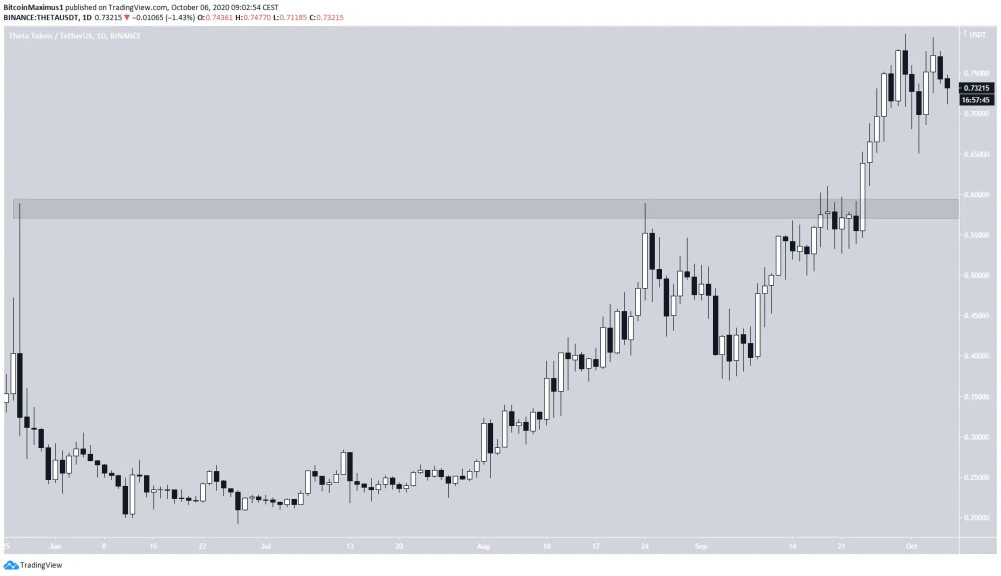
The Theta Network (THETA) token price broke out and reached a new all-time high on Sept 24.
The price has yet to show any clear signs of weakness and has allowed THETA to climb up another level.
THETA All-Time High
On Sept 24, THETA broke out from the $0.585 resistance area and reached a new all-time high. Previously, the price had made two attempts at breaking out, on May 27 and Aug. 24.
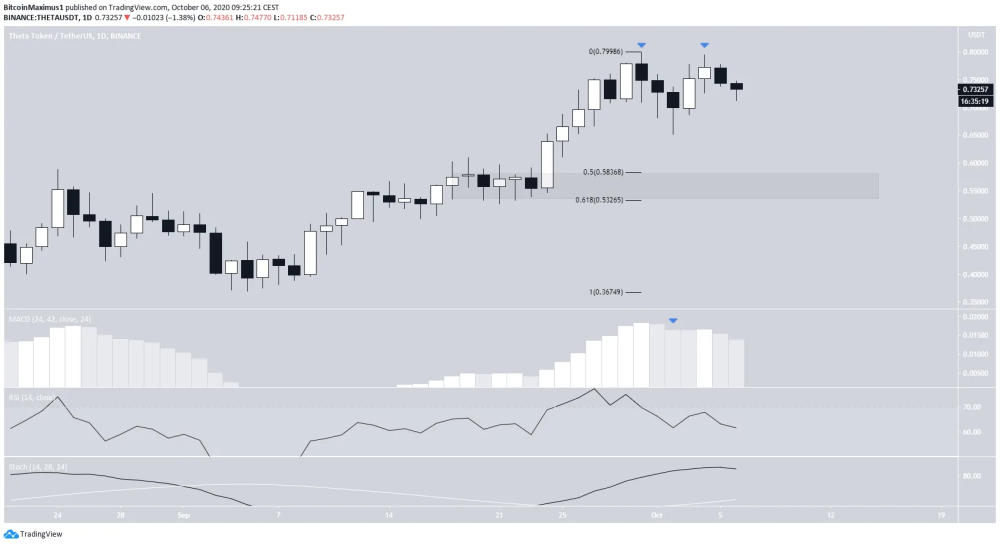
The price continued to increase until it reached a high of $0.798 on Sept 30. This was an increase of around 37% relative to the breakout price level. However, it has created a lower high since then.
The daily chart shows some weakness, but not enough to confirm a reversal. The lower highs have had upper wicks, a sign of selling pressure. In addition, the MACD and RSI are both decreasing.
If the price were to retrace, the $0.52-$0.56 area would be likely to offer support, as they make up the 0.5-0.618 Fib levels of the upward move that led to the breakout.
Wave Count
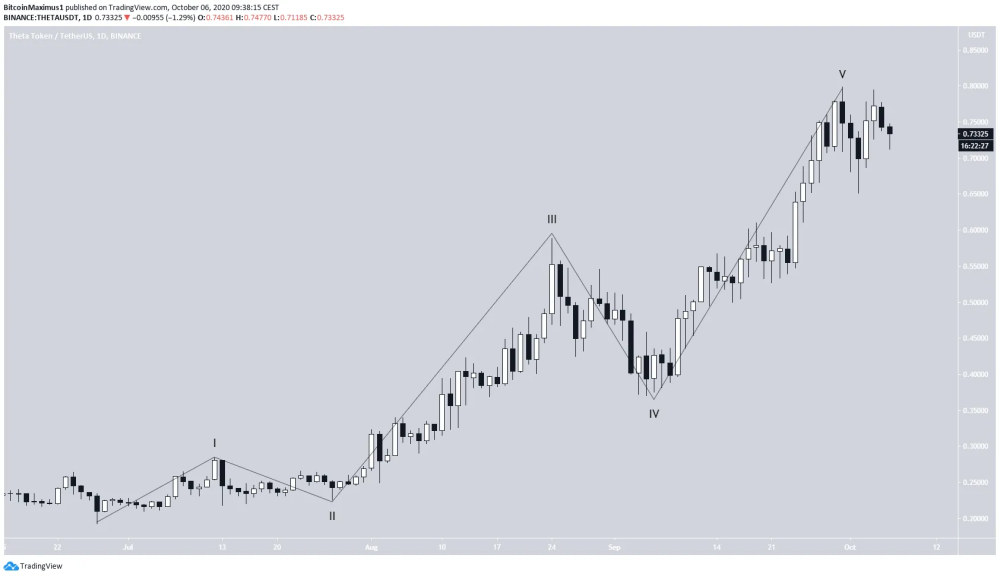
It is likely that THETA began a bullish impulse with the June 27 low of $0.192 (shown in black below). Since then, the price has likely completed waves 1-4, and is currently in wave 5.
Considering that the price is at an all-time high, there are no resistance levels above the current price that would assist in determining the next high.
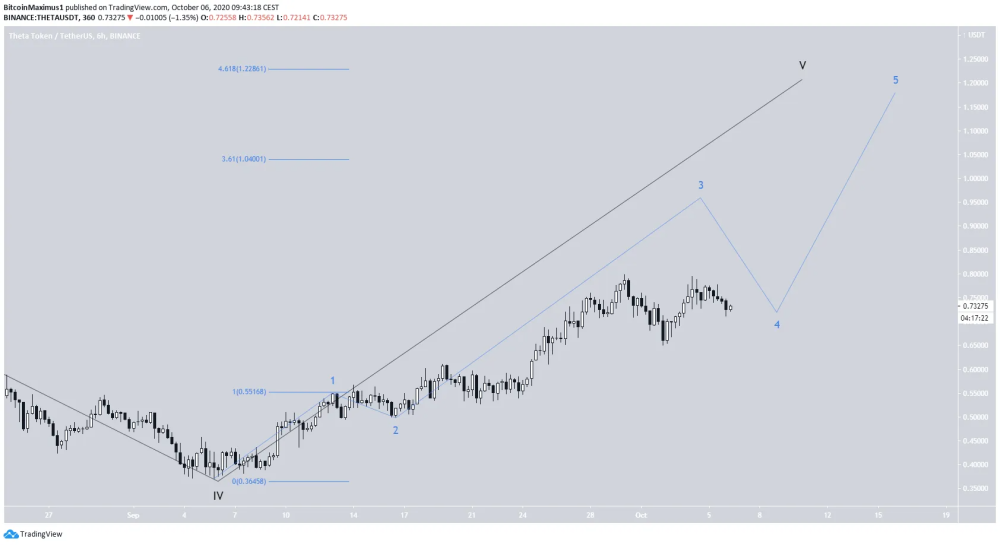
A closer look at wave 5 reveals that the price is likely in sub-wave 3 of a bullish impulse (blue). Preliminary targets for the top of the move would be found between $1.04-$1.22, the 3.61-4.61 Fib levels of wave 1.
THETA/BTC
The THETA/BTC price movement is similar to its USD counterpart but has more of a bearish bias.
While the price has created a higher high instead of a lower high, both highs were combined with very long upper wicks, and the Oct 4 candlestick was a shooting star.
Furthermore, there is a significant bearish divergence in both the RSI and MACD, which are decreasing quickly.
A bearish cross in the Stochastic Oscillator would likely confirm that the trend is bearish.
A retracement could take the price towards 5,800 satoshis.
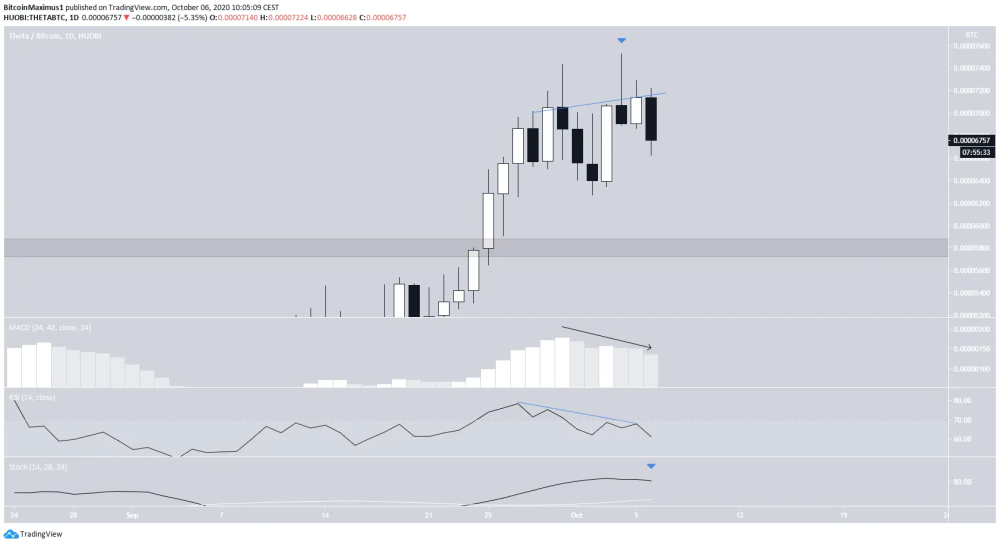
To conclude, while the THETA/USD price could continue to increase, it is possible that THETA/BTC has reached a short or medium-term top.
What do you think we will see in the coming week / month? Do you agree with the above analysis? Also If you like this content, consider tipping the article / following me, so more people see this content and we get a nice discussion going on.
Also, If you are interested in trading, I would suggest you try out BeInCrypto's free Telegram chat. I am there and it is growing very quickly (over 7,700 members) where they discuss the market and share interesting content. They also have a free premium channel where they have a cryptocurrency trading course and daily trading signals. If you are interested, you can click here.
Until next time, stay classy crypto world!


