
The Compound (COMP) price has fallen below a long-term support level and has proceeded to fall to a new all-time low. However, the price is trading inside a bullish pattern from which a breakout is expected.
All-Time High to All-Time Low
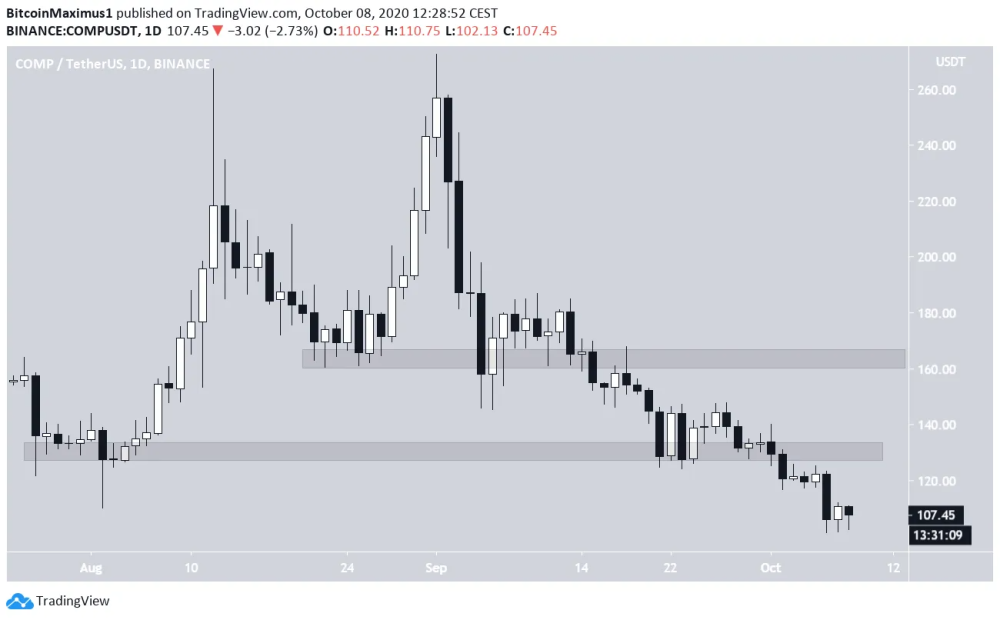
On Sept 1, COMP reached a new all-time high price when it touched $272.61. What ensued was a very sharp drop that has caused breakdowns from numerous support levels.
More recently, the price made a failed attempt at initiating a bounce on Sept 23, but the upward move could not be sustained, and the price fell below the $130 support level shortly afterward. This caused COMP to continue its descent.
So far, it has reached a low of $101.16, which is a new all-time low price.
Until the price reclaims the $130 area, the trend is considered bearish. Even if the price successfully reclaims it, there are several resistance areas above, starting with the $163 area.
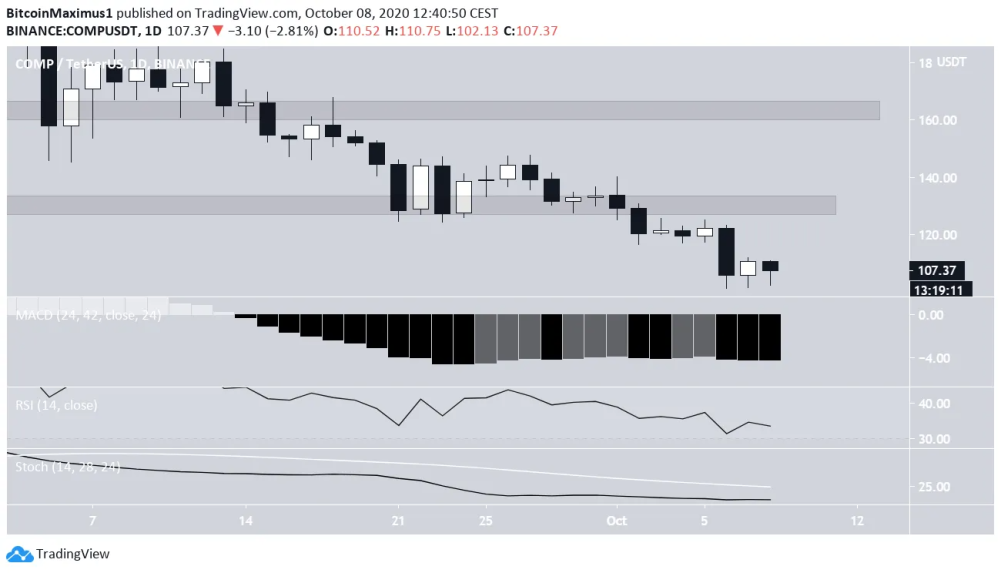
There are no bullish reversal signs, at least not on the daily time-frame.
The RSI and Stochastic Oscillator are falling, and the MACD made a failed attempt at moving upwards and has begun to decline once more.
Future Movement
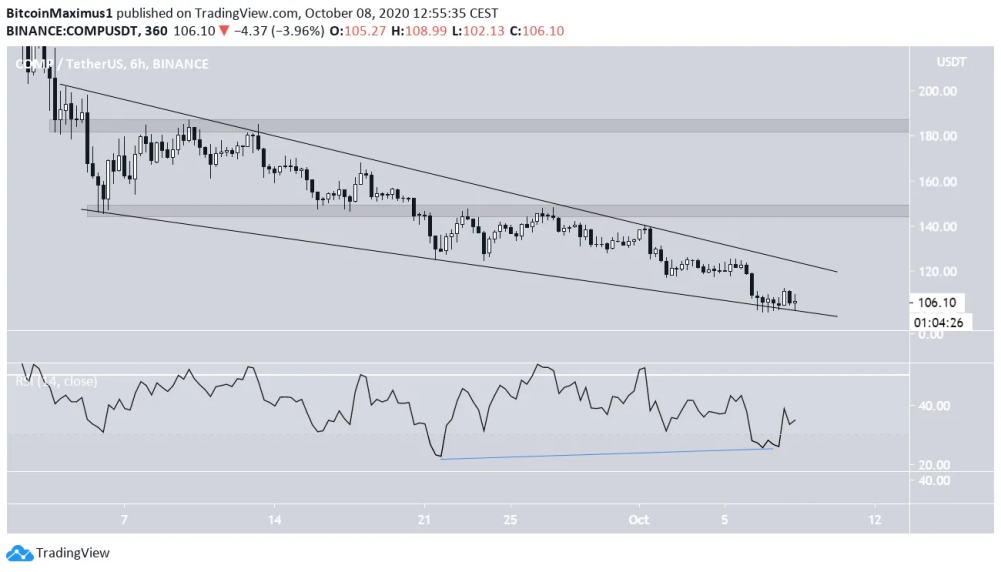
it looks like it has created a descending wedge, which is a bullish reversal pattern. The price is approaching the end of the wedge and trading just above its support line.
The RSI has formed considerable bullish divergence inside its oversold region, a sign that the price should successfully break out. If it does, the closest resistance areas are found at $145 and $185, respectively.
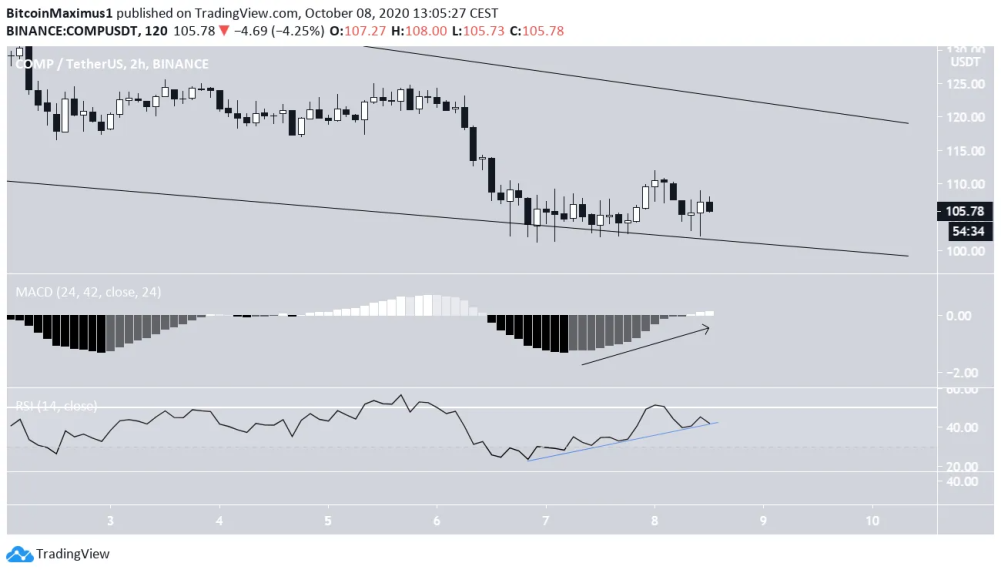
The short-term chart supports this possibility since there is a pronounced bullish divergence on the RSI that has created an ascending support trendline. Furthermore, the MACD has crossed into positive territory.
Therefore, a rally towards the resistance line of the wedge looks very likely, with a possible breakout following.
To conclude, even though COMP has just reached a new all-time low price, a breakout from the current pattern is expected, which could take the price towards the resistance levels outlined above.
What do you think we will see in the coming week / month? If you like this content, consider tipping the article / following me, so more people see this content and we get a nice discussion going on.
Also, If you are interested in trading, I would suggest you try out BeInCrypto's free Telegram chat. I am there and it is growing very quickly (over 7,700 members) where they discuss the market and share interesting content. They also have a free premium channel where they have a cryptocurrency trading course and daily trading signals. If you are interested, you can click here.
Until next time, stay classy crypto world!


