
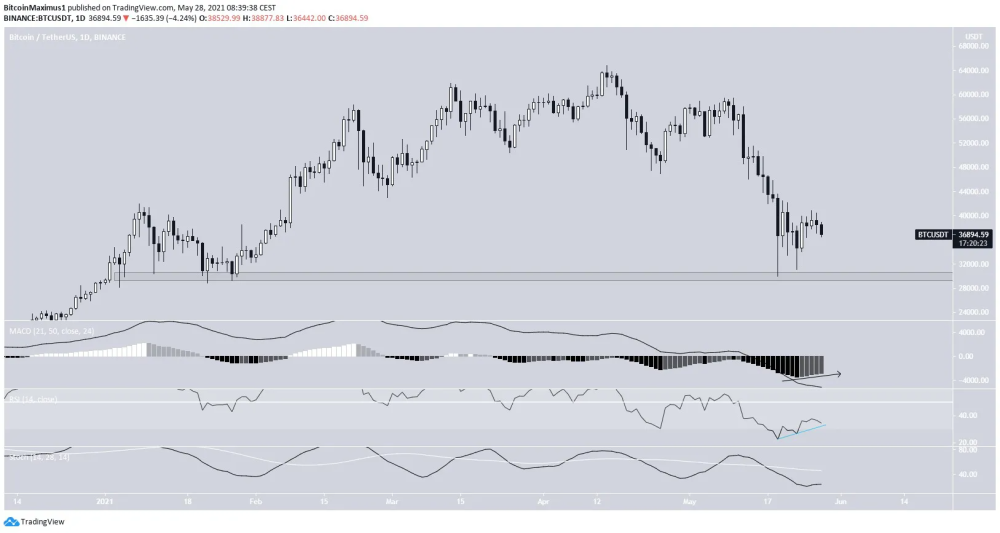
The price of Bitcoin (BTC) has been increasing since May 19 but is struggling to sustain the upward movement.
The creation of a higher low near the current price level is essential for the continuation of the upward trend.
BTC struggles to sustain rally
BTC has been increasing since May 19, when it reached a low of $30,000. It managed to reach a local high of $40,841 on May 26. However, it has been falling since.
Despite the drop, technical indicators are turning bullish. The MACD has given a bullish reversal signal and created four successive higher momentum bars. The RSI is increasing, looking to make its second higher low. Finally, the Stochastic oscillator is showing signs of moving upwards.
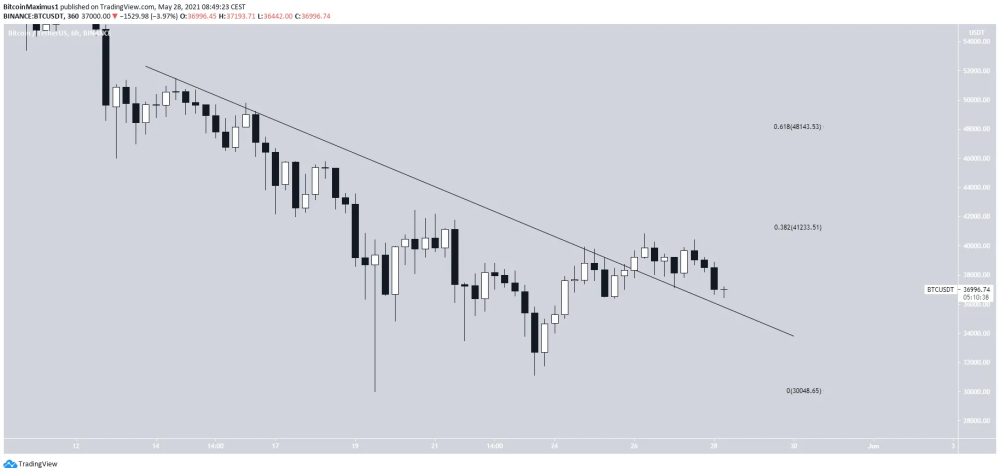
Ongoing BTC breakout
The six-hour chart shows a breakout from a descending resistance line. While the rally could not be sustained, BTC is still trading above this line, potentially validating it as support.
There are resistance levels at $41,200 and $41,850. These are the respective 0.382 and 0.618 Fib retracement levels.
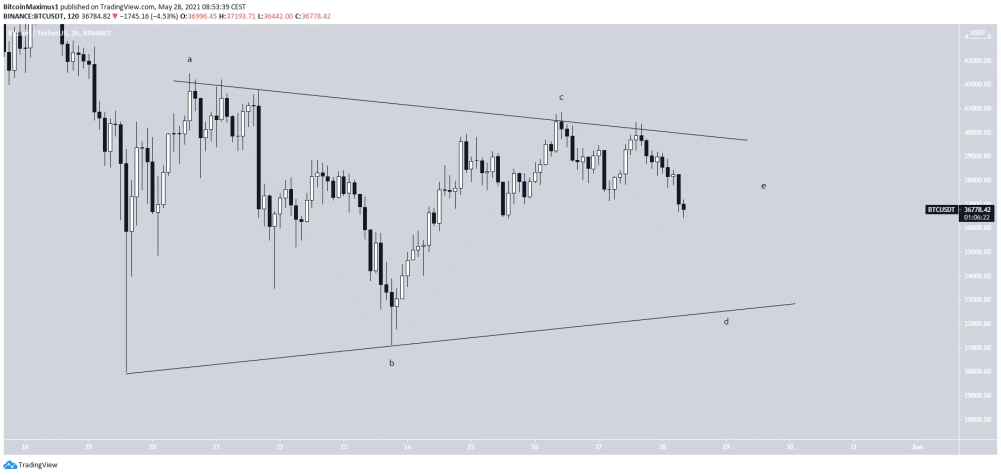
The one-hour chart shows that throughout the ongoing decrease, BTC has been trading inside a descending parallel channel. This could be a corrective movement.
The price is currently trading right at the support line of the channel. It previously touched the 0.5 Fib retracement support level at $36,000.
Thus, if the rally is to continue, the creation of a higher low is crucial at these levels.
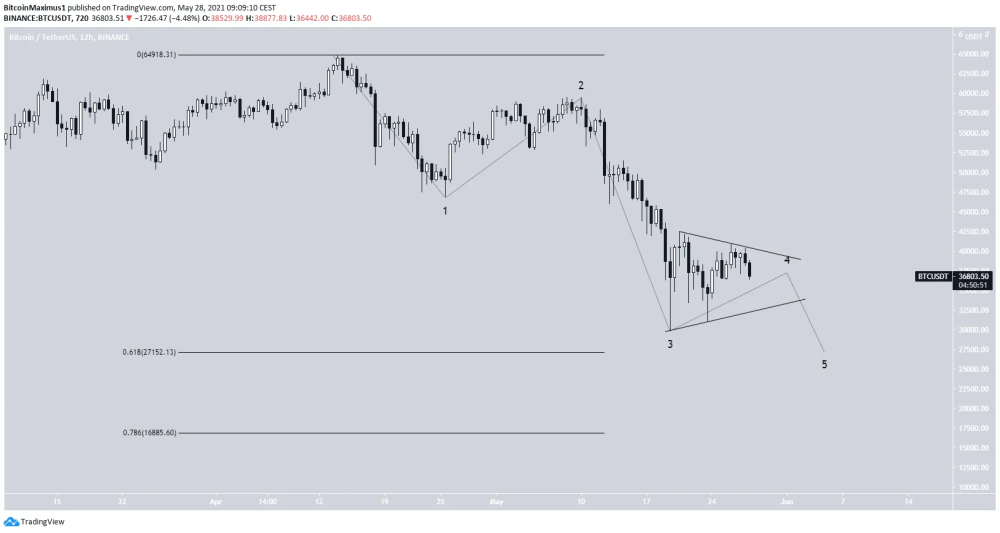
Wave count
The most likely wave count indicates that the previous decrease is an A-B-C corrective structure, in which waves A:C had a 1:1.61 ratio.
This would be confirmed by an increase above the A wave low at $47,004 (red line) and would fit with the long-term BTC count.
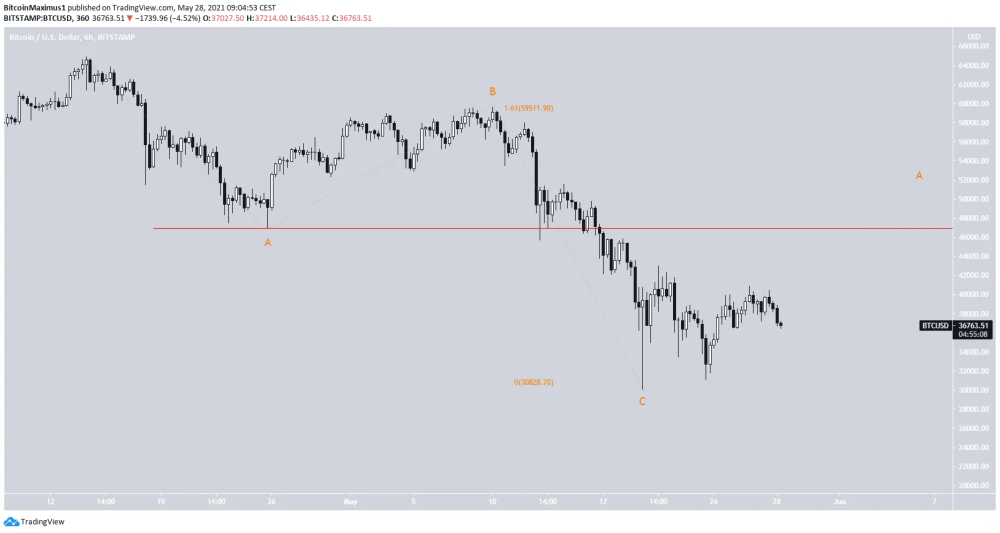
However, there is a possibility that the decrease was a bearish impulse and BTC is now in wave four.
If this is the case, the price could be trading inside a symmetrical triangle. For that reason, it might fall towards the $33,000 region before bouncing once more.

As a result, the decrease could continue towards $27,152, the long-term 0.618 Fib retracement support level.
Therefore, the current short-term movement is crucial, since a fall towards the $33,000 levels could indicate that the longer-term correction is not over yet.
Where do you think the BTC price is going? Leave a comment and let's get some dialogue going! If you like this type of content, consider following me here and leaving a tip.
Also if you are on Twitter, why not give me a follow and start some conversations? You can find me here - https://twitter.com/dizzlecrypto.
Until next time, stay classy crypto world!


