
The Bitcoin (BTC) price has increased significantly over the past two weeks but has created a bearish pattern in the short-term.
Technical indicators are also showing weakness, indicating a retracement could be in the cards.
Bitcoin Double-Top Implies Weakness
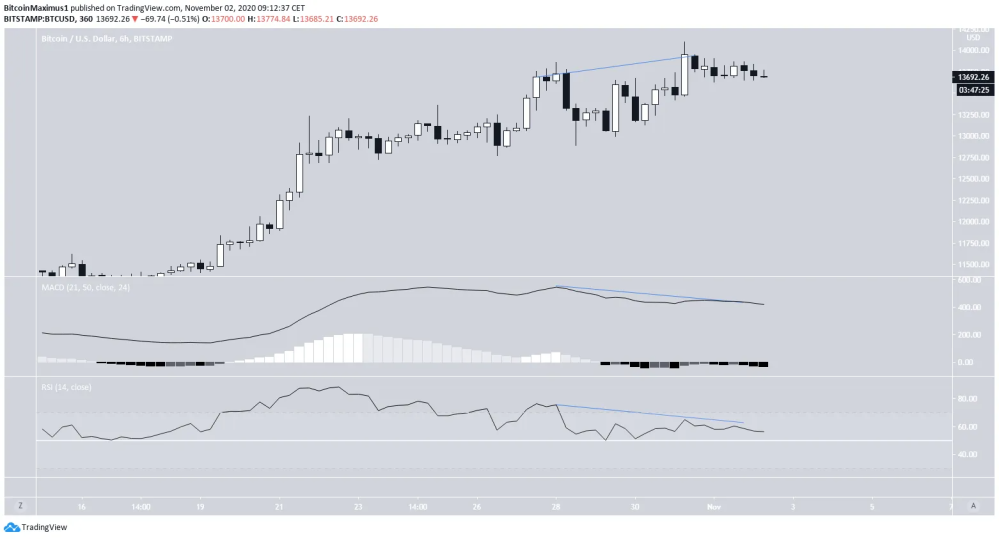
In the period between Oct 28-31, the BTC price created a double-top pattern near $14,000. The double-top is normally considered a bearish reversal pattern.
The pattern has also been combined with a significant bearish divergence in both the RSI and MACD. While the former is still trading above 50, the latter has crossed into negative territory — a sign that the short-term trend is turning bearish.
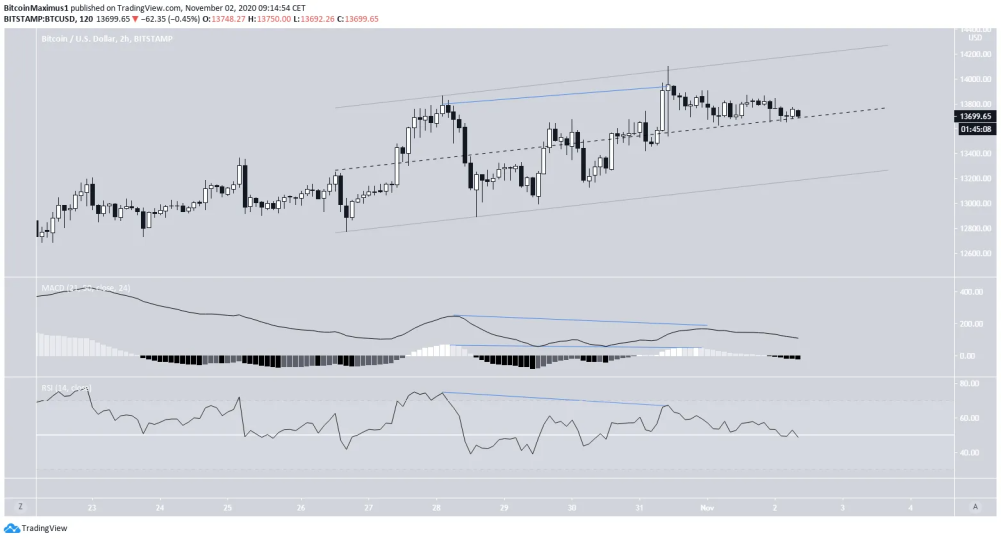
The shorter-term two-hour chart shows an even more pronounced bearish divergence in both the RSI and MACD.
In addition, BTC seems to be trading inside a parallel ascending channel and is currently sitting on the midline.
Besides the divergence, movement contained inside a parallel channel is most often corrective, allowing for the possibility of a drop. If so, the closest support would be at the ascending support line of the channel near $13,200.
Wave Count
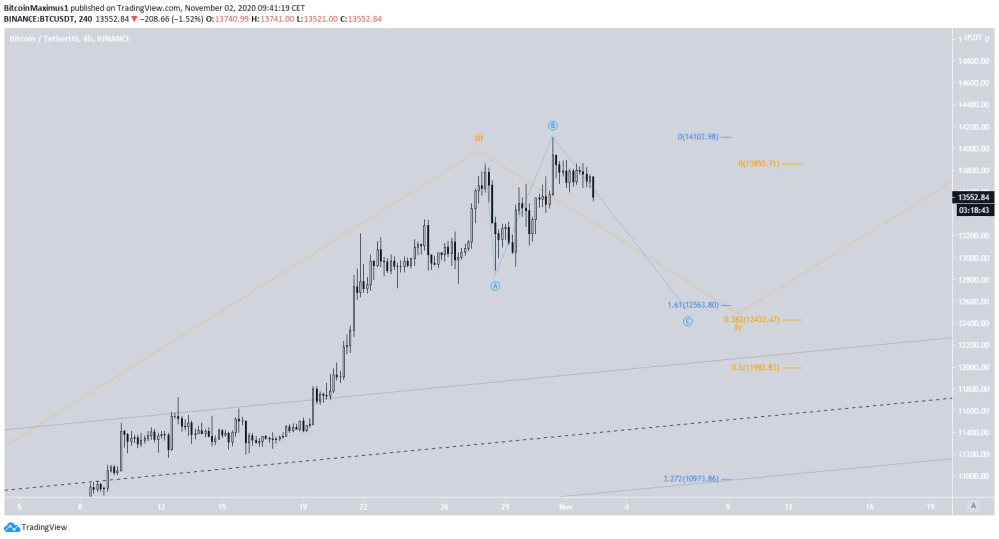
The short-term count (blue) suggests that the price has just begun the C wave, which would complete the aforementioned wave 4 (orange).
The most likely level for this wave to end would be between $12,430-$12,530, the 1.61 Fib extension of sub-wave a (blue) and the 0.382 Fib level of wave 3 (orange).
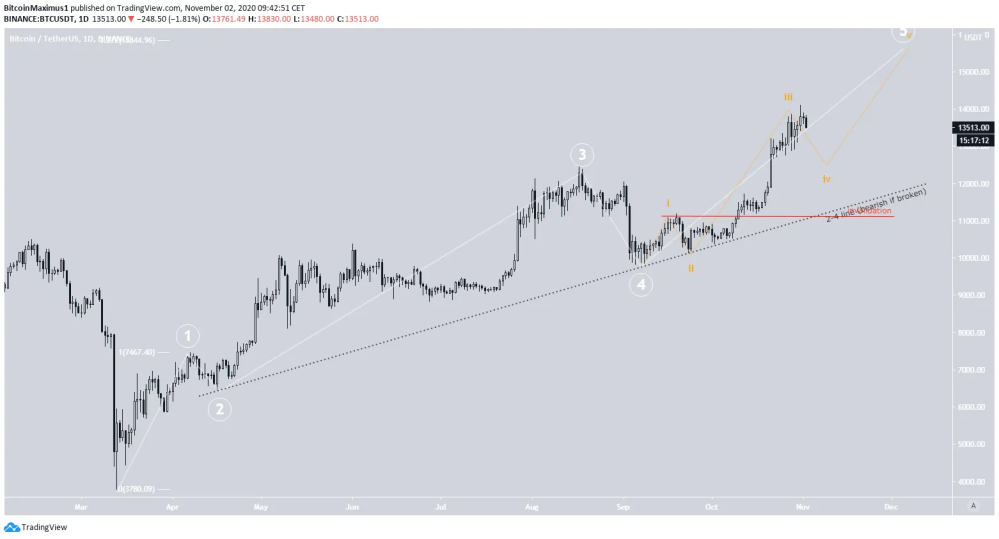
In the longer-term, another increase is expected after the completion of wave 4 which could take BTC towards $16,000.
The formation would be invalidated by a decrease below the wave 1 high at $11,093 and would be partially invalidated by a breakdown below the 2-4 line (dashed), currently near $11,300.
Conclusion
To conclude, the multiple bearish divergences and the presence of a double-top make it likely that BTC is correcting.
A breakdown from the channel would likely accelerate the rate of decrease, causing a sharp drop towards the targets outlined above.
What do you think we will see in the coming week / month? If you like this content, consider tipping the article / following me, so more people see this content and we get a nice discussion going on.
Also, If you are interested in trading, I would suggest you try out BeInCrypto's free Telegram chat. I am there and it is growing very quickly (over 8,200 members) where they discuss the market and share interesting content. They also have a free premium channel where they have a cryptocurrency trading course and daily trading signals. If you are interested, you can click here.
Until next time, stay classy crypto world!


