
The Binance Coin (BNB) price has been struggling to move above the $32 resistance area since late August.
Indicators have turned bearish and Binance Coin is expected to complete another drop towards support targets before possibly moving upwards once again.
BNB Long-Term Double Top
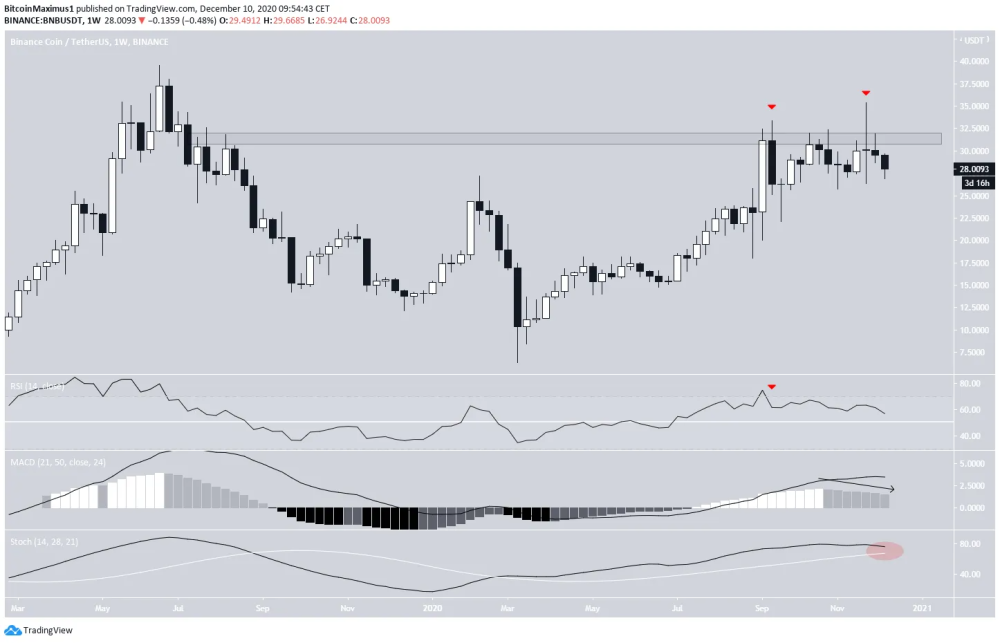
The BNB price has been moving upwards since reaching a low of $6.38 in March. The upward move has led to two highs at $33.38 and $35.48 in September and November respectively.
However, both weekly closes were below $32, leaving two long upper wicks and solidifying the area as resistance. The movement resembles a double top, which is normally considered a bearish reversal pattern.
Furthermore, technical indicators have begun to turn bearish. The RSI has decreased below 70 and the MACD and Stochastic oscillator are falling.
Future Movement
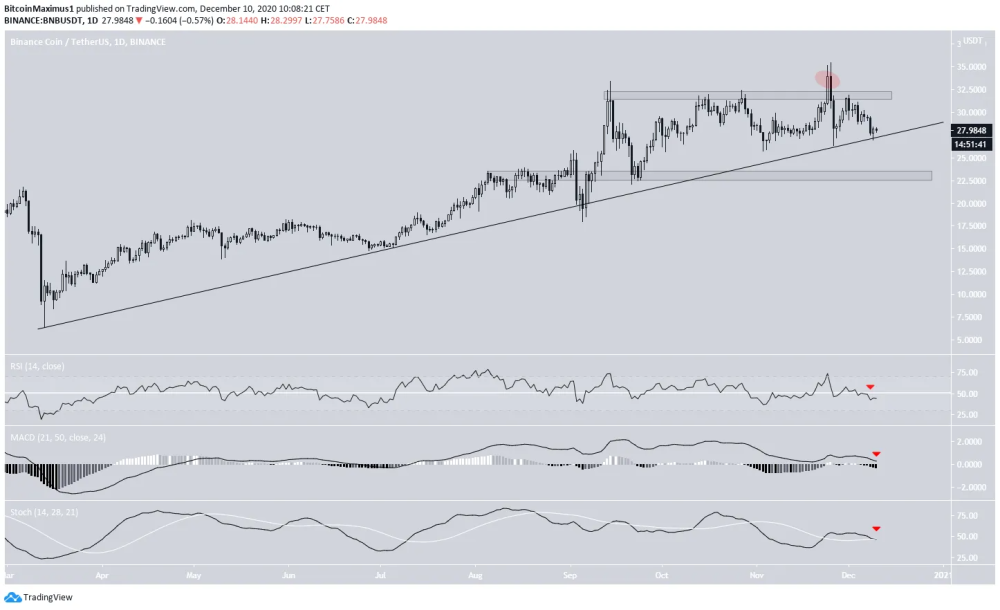
The daily chart shows that BNB has been following an ascending support line since reaching a low of $6.38 on March 13 and has returned to validate it once more. A breakdown from this line would likely take BNB to the lower support at $23.
This time-frame shows the deviation above $32 more clearly (red circle below). This deviation led to a sharp drop shortly after.
Technical indicators are bearish, supporting the possibility that BNB will break down from this line and drop towards $23.
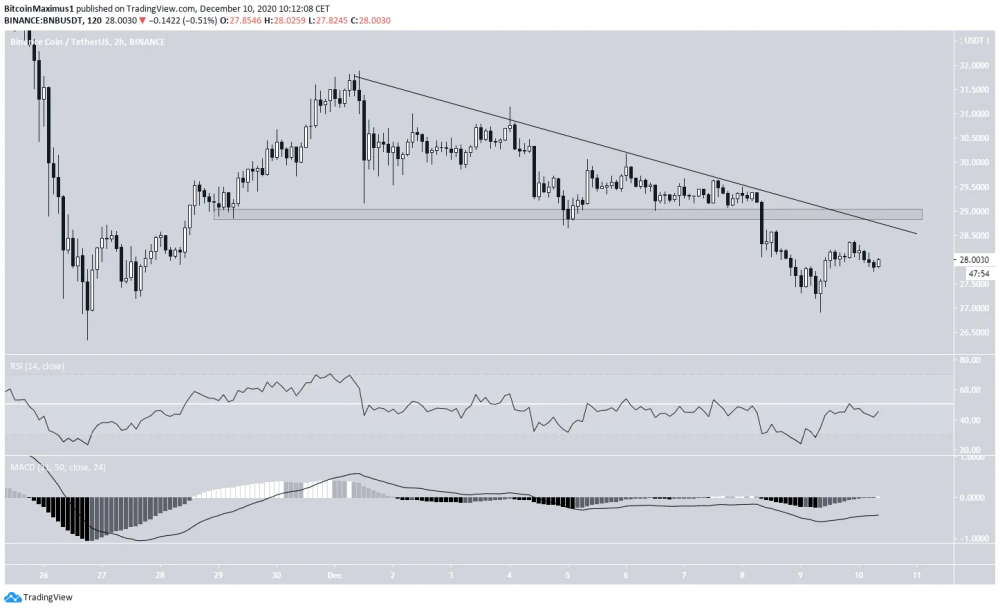
While the two-hour chart shows a possible double bottom and some bullish reversal signs, BNB would have to break out from its descending resistance line and reclaim $29 in order for the short-term trend to be considered bullish.
Wave Count
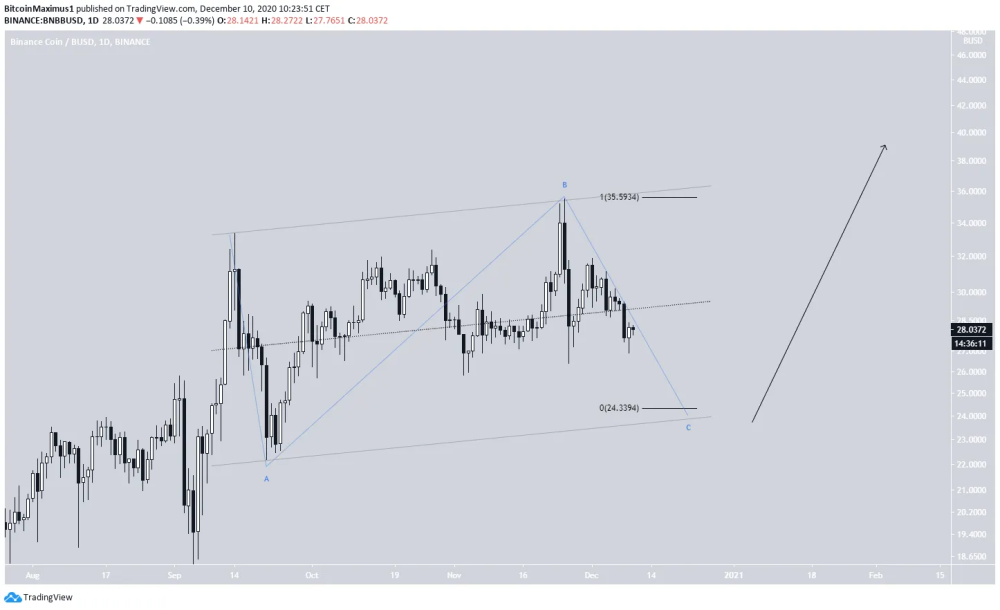
While the entire wave count is not yet determined, the movement since the Sept. 14 highs closely resemble a flat A-B-C correction (shown in blue below). In addition, the price seems to be channeling, supporting the possibility that this is a corrective structure.
If accurate, BNB is now in the C wave, which will likely to end near $24. This level is the support line of the parallel channel and the length of wave A projected to the top of B.
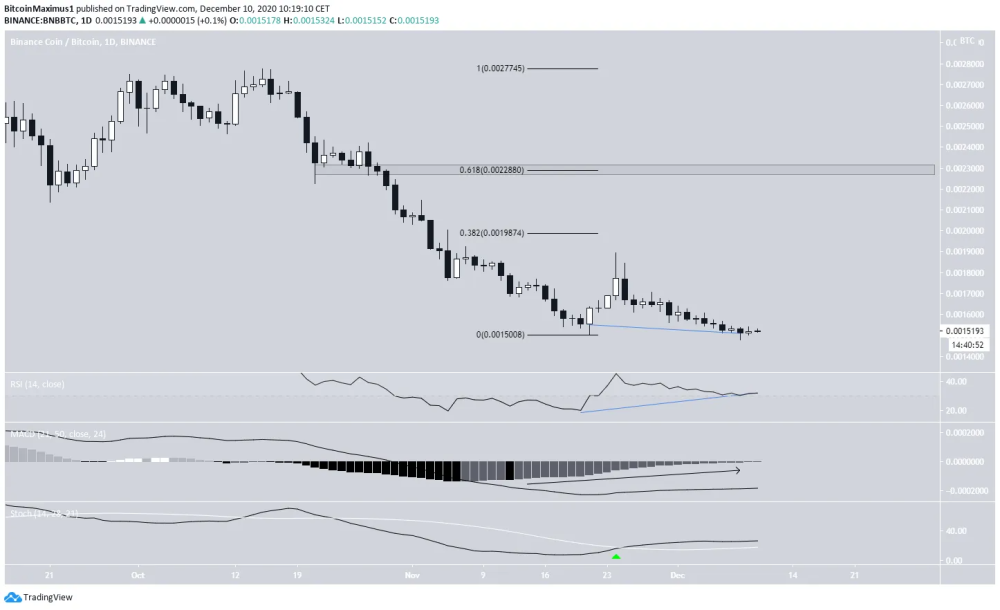
BNB/BTC
While BNB has retraced since its short-term breakout, it has created what resembles a double bottom pattern, which is also combined with a bullish divergence in the RSI.
Furthermore, both the MACD and Stochastic oscillator have turned bullish.
Therefore, BNB/BTC is expected to move upwards toward ₿0.0020 and possibly ₿0.023. These targets are the 0.382 and 0.618 Fib retracement levels of the previous downward movement.
Conclusion
The Binance Coin price is likely still correcting as a result of the September rejection.
While BNB is expected to eventually move upwards and reach new highs, another drop towards $23-24 seems likely before BNB begins to increase.
What do you think we will see in the coming week / month? Do you agree with the above analysis? Also If you like this content, consider tipping the article / following me, so more people see this content and we get a nice discussion going on.
Also, If you are interested in trading, I would suggest you try out BeInCrypto's free Telegram chat. I am there and it is growing very quickly (over 9,600 members) where they discuss the market and share interesting content. They also have a free premium channel where they have a cryptocurrency trading course and daily trading signals. If you are interested, you can click here.
Until next time, stay classy crypto world!


