
Impermanent loss (IL) remains a “scary,” daunting, poorly named phrase that frightens people off from participating in DeFi liquidity pools. While it certainly introduces new risks compared to merely holding cryptocurrency tokens (which already carry a lot of risk), it feels that few people grasp what it actually means and how future prices really impact returns when adding liquidity.
Today, I’ll share a quick update to my Illuvium staking calculator, with a new tab focused on a visualization of impermanent loss impact. This tab (or the independent sheet here) can be used for any liquidity pair to assess the potential impact of IL.
If you already understand impermanent loss, feel free to scroll through the next section to the VISUALIZING IMPERMANENT LOSS header below.
Basics of Impermanent Loss
I covered the topic of impermanent loss much more extensively in my blog series here. Briefly, IL or my preferred term “divergence loss” is the phenomenon in automated market making (AMM) liquidity pairs where participants adding liquidity incur a loss due to the price ratio of the two tokens moving apart, or diverging. Token prices can diverge in multiple ways - one token can increase in price more than the other, one can decrease in price more than the other, or one token can increase in price while the other decreases. For divergence loss, what really matters is the price ratio at the time you add liquidity (initial price ratio) and the time you remove your liquidity (final price ratio). At any point while you hold liquidity in a pool, the price ratio divergence will impact your current value, but as the poorly named title says, those losses are “impermanent.” Once you remove your liquidity, the loss becomes very real and very permanent, just like any time you sell a token. As for why this happens, the reason is arbitrage trading. Here’s a video that explains impermanent loss and arbitrage trading in more detail.
Divergence loss can be calculated using the below equation, or any number of online calculators that enable you to avoid doing math, such as this one. Price ratio is all that matters, and it doesn’t matter which token’s price you put on top or the bottom, as long as you do it the same for both the initial and final ratio.
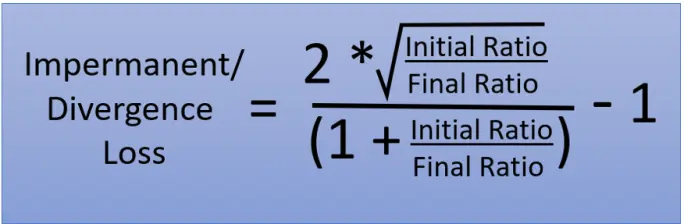
The loss is represented as a percentage. But what does that percentage mean?
Quick Divergence Loss Examples
The divergence loss is the decrease in value relative to just holding the two tokens and not adding liquidity. A quick example - say you have $20, and you buy ten of token A at $1 and one token B at $10. If token A increases to $2, your total value becomes $30. However, if you added liquidity to the A/B pool, your divergence loss would be 5.72%, meaning rather than having $30, you would have $28.28, incurring a loss of $1.71 compared to just holding the tokens. You’re still up, you just aren’t as positive as you would have been had you not pooled the tokens.
For another example, let’s say the value of Token B above decreases to $5. Had you not pooled, you would have $15 (10x Token A at $1, 1x Token B at $5). However, if you added them to a liquidity pool, you would end up with $14.14. You would have incurred the loss from Token B losing value, minus the additional loss due to price divergence.
Typically, liquidity pools provide incentives to those providing liquidity, such as the Illuvium SLP yield farming rewards, or farming pools on Sushi where you are offered another token as a reward for pooling. All liquidity pools also reward those adding liquidity with transaction fees, as Sushi.com takes 0.3% of every transaction, with 0.25% of that value added back to the pool. These fees are automatically added, and the value of your liquidity pair tokens reflects this gain. You can quickly estimate your daily benefit from fees by knowing your current pool value and the pool utilization ratio, which is found on the analytics page for the pool (here’s the Sushi ILV/ETH pair analytics). Take your current value multiply by the utilization ratio, and then multiply by 0.25%. For example, if you have $1000 in a pool with a 10% utilization, you are earning $0.25 per day in fees.
$1000 x 10% utilized per day x 0.25% = $0.25
VISUALIZING IMPERMANENT LOSS
My new tab and the independent sheet here include two tables. Note: To get an editable version, click File -> Make a copy. I will not give permission to edit these files directly.
Directions: To set up the sheet, just add your token symbols to cells C4 and E4, and your initial prices when pools to D4 and F4.
Divergence Loss Table: The top table will calculate divergence loss for a range of potential future values of both tokens, both showing potential increases and decreases. In the middle of the table is the larger 0.00%, which is the cell indicating the current price ratio. You will see if you move diagonally from this cell, the ratio stays the same, and impermanent loss remains at 0.00%. Again, if the ratio stays the same, there is no divergence loss.
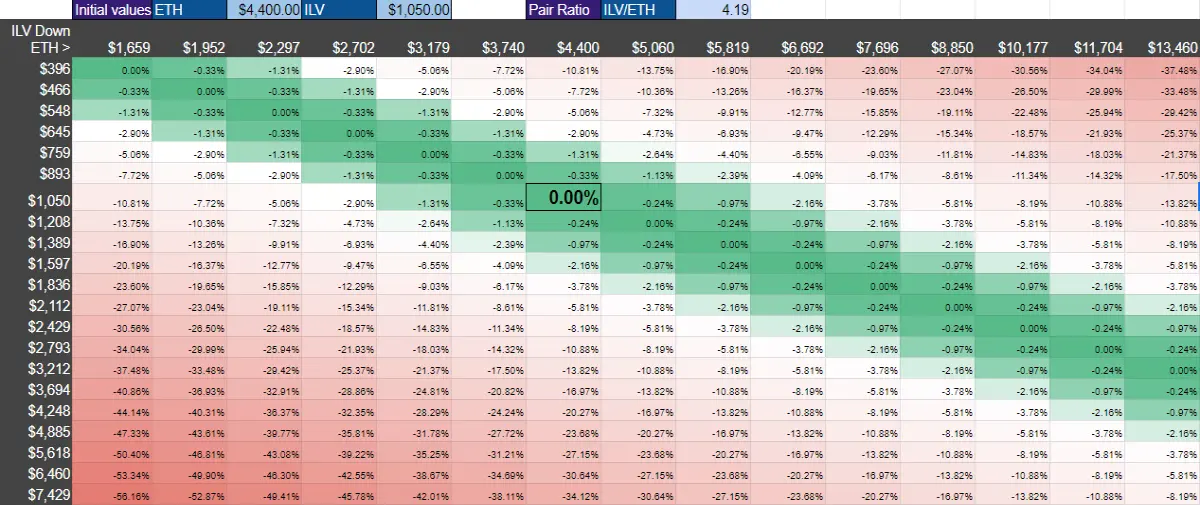
If you move horizontally from the middle 0.00%, you are changing the value only of the first token, thus the ratio is changing. In the image above, if the price of ETH goes to $10,177 while ILV stays at $1,050, divergence loss is 8.19%. If you move vertically, only the price of the second token changes, so if ETH stays at $4,400 while ILV goes to $4,885, divergence loss is 23.7%.
Now, you can evaluate hypothetical price movements, such as if ETH decreases to $2,297 while ILV increases to $2,112 (DL = 19.11%), or if ETH increases to $6,692 and ILV increases to $7,429 (DL = 23.7%).
Real Return Table: Remember, divergence loss is just the impact of pooling compared to holding, but it doesn’t really tell you the real price performance of your investment in the two tokens. The bottom table gives you the real return of your investment, considering divergence loss. The table follows identical hypothetical prices as the top table, but now gives you a real return on investment. The values shown are percent gain or loss, so to determine your actual return, take your initial investment multiplied by the percentage in the table. For example, if you invested $1000 in the liquidity pool shown, if the prices stay exactly the same as your initial conditions, your return is 0.00%. You still have your initial $1000, but you had no gain, or loss.
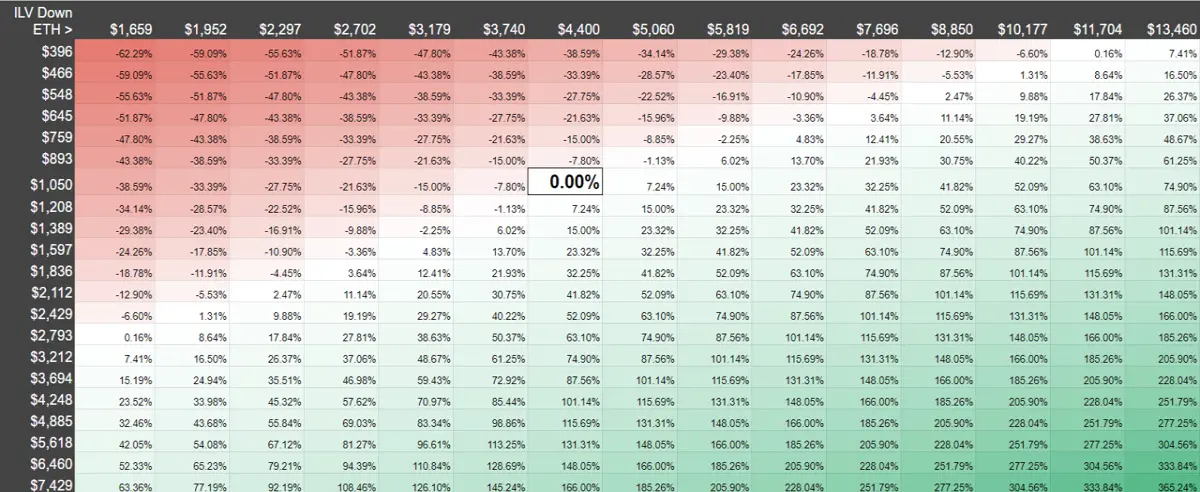
Looking at the above examples, if ETH goes to $10,177 while ILV stays at $1,050, your real return is 52.1% after divergence loss, so your $1000 becomes $1521.
If ILV goes to $4885 while ETH stays at $4400, your real return is 115.7%, giving you a value of $2,157.
If ETH decreases to $2,297 while ILV increases to $2,112 (DL = 19.11%), your real return is 2.47%, so your new value is $1025.
If ETH increases to $6,692 and ILV increases to $7,429 (DL = 23.7%), your real return is 228%, giving you a value of $3,280.
Summary
Hopefully this gives you a tool that you can use to quickly evaluate hypothetical price movement in a liquidity pair and determine both your divergence loss, along with what it REALLY means in terms of investing, your real return on investment. While impermanent loss certainly has an impact, the bottom table should give you greater confidence in how price divergence impacts your future value based on potential price movement.
These tables neglect any value from transaction fees or yield farming, so consider those and their consistency when you consider participating in any liquidity pool.
I hope you found this tool useful in evaluating future participation in liquidity pools. Thanks as always for reading, feel free to comment if you have any questions, and thanks for your support!






