you may need 2 or 3 minutes reading this, or maximum one or two days to read and watch some youtube videos about Pivot Points, but believe me if you really get the whole idea of PP, you'll turn any trading strategy in to a way more efficient way of making money. So just give it a chance.
Pivot points are a popular tool in technical analysis used by traders to identify potential support and resistance levels in the market. They are calculated based on the high, low, and closing prices of the previous trading session. The main pivot point acts as a benchmark, and additional levels (support and resistance) are derived from it.
Traders often use pivot points to determine market trends, entry and exit points, and potential reversal zones. They can be particularly useful in day trading and short-term trading strategies.
Pivot points are calculated using the high, low, and closing prices of a previous trading session (usually the daily session). Here's the formula for the main pivot point (P) and the support and resistance levels: (Or you just use indicators or website to have the levels)
- Pivot Point (P):
P=High+Low+Close / 3
- Support and Resistance Levels:
- Resistance 1 (R1):
R1=(2×P)−Low
- Support 1 (S1):
S1=(2×P)−High
- Resistance 2 (R2):
R2=P+(High−Low)
- Support 2 (S2):
S2=P−(High−Low)
You can extend this calculation for additional levels, such as R3 and S3, but these are the most commonly used.
These calculations create a framework of levels that traders often use to identify potential support and resistance areas.
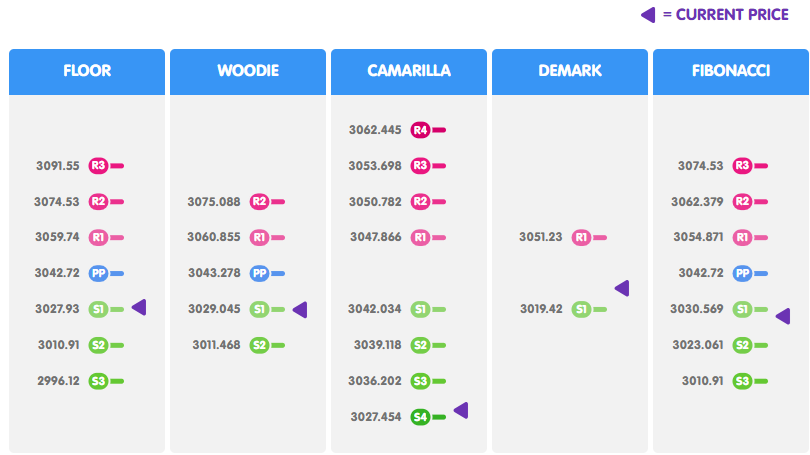
if you are not a fan of maths, you can use websites doing it for you. my favorite is babypips.com and here is GOLD daily pivot points by them for example: https://marketmilk.babypips.com/symbols/XAUUSD/pivot-points
Traders use pivot points in a variety of strategies to identify potential support and resistance levels, as well as to gauge market sentiment. Here are some common ways pivot points are applied in trading strategies:
- Identifying Trend Direction:
- If the price is trading above the main pivot point (P), it is considered bullish, indicating an uptrend.
- If the price is trading below the pivot point, it is considered bearish, signaling a downtrend.
Support and Resistance Levels:
- Pivot points and the corresponding support (S1, S2) and resistance (R1, R2) levels act as markers where the price may reverse or consolidate.
- Traders use these levels to set stop-loss orders or take-profit targets.
Breakout Strategies:
- When the price breaks through a resistance level (e.g., R1), it may signal a continuation of the uptrend.
- Similarly, breaking through a support level (e.g., S1) may indicate a continuation of the downtrend.
Reversal Opportunities:
- If the price approaches a support or resistance level and fails to break through, it may indicate a reversal.
- Traders may enter positions in the opposite direction, anticipating a bounce off these levels.
Combining with Other Indicators:
- Traders often pair pivot points with other technical indicators like moving averages, Relative Strength Index (RSI), or MACD for confirmation.
- For instance, if RSI shows overbought conditions near a resistance level, a trader might anticipate a price reversal.
Intraday Trading:
- Pivot points are particularly useful for short-term and intraday traders, as they provide a framework for quick decision-making based on market behavior.
Pivot Point Controversy
As the price moves further away from the pivot point (PP), it can indeed suggest an imbalance—either excessive bullish or bearish momentum. Here's why a pullback might occur:
- Overextended Market: When the price deviates significantly from the PP or even the resistance (R) or support (S) levels, it can indicate that the market is overbought or oversold. Traders might then take profits, leading to a pullback toward the PP or nearby levels.
- Reversion to the Mean: In many cases, prices tend to revert to average levels over time. The PP often acts as a magnet, especially in ranging or consolidating markets, pulling the price back closer to balance.
- Key Decision Zones: The PP represents a critical zone where buyers and sellers often reassess their strategies. As prices stray too far, the likelihood of buyers or sellers stepping in to correct the imbalance increases.
That said, the context matters. Strong trends can keep the price far from the PP for an extended period, especially when supported by high volume and bullish or bearish momentum. Combining pivot points with indicators like RSI (to measure overbought/oversold conditions) or Bollinger Bands (to check for extremes) can help you confirm whether a pullback is likely.
Here is a video I made on Pivot Points and how to trade with it, but it's in Persian Language.
Divergence
Divergence occurs when the price of an asset moves in the opposite direction of an indicator (like RSI or MACD). Pivot points and divergence strategies can be combined effectively to identify potential trade opportunities.
Combine the Two:
-
Look for divergence near pivot points. If a bullish divergence forms near a support pivot point, it could indicate a strong buy signal.
-
Similarly, if a bearish divergence forms near a resistance pivot point, it could indicate a strong sell signal.
Confirm the Signal: Use additional indicators or candlestick patterns to confirm the trade setup. This reduces the risk of false signals.
Set Entry and Exit Points: Enter the trade when the divergence is confirmed, and set stop-loss levels just below the support (for bullish trades) or above the resistance (for bearish trades).
This combination works well in various markets, including forex, stocks, and commodities.


