The concept of Imbalances and liquidity levels align with some key concepts in price action trading.
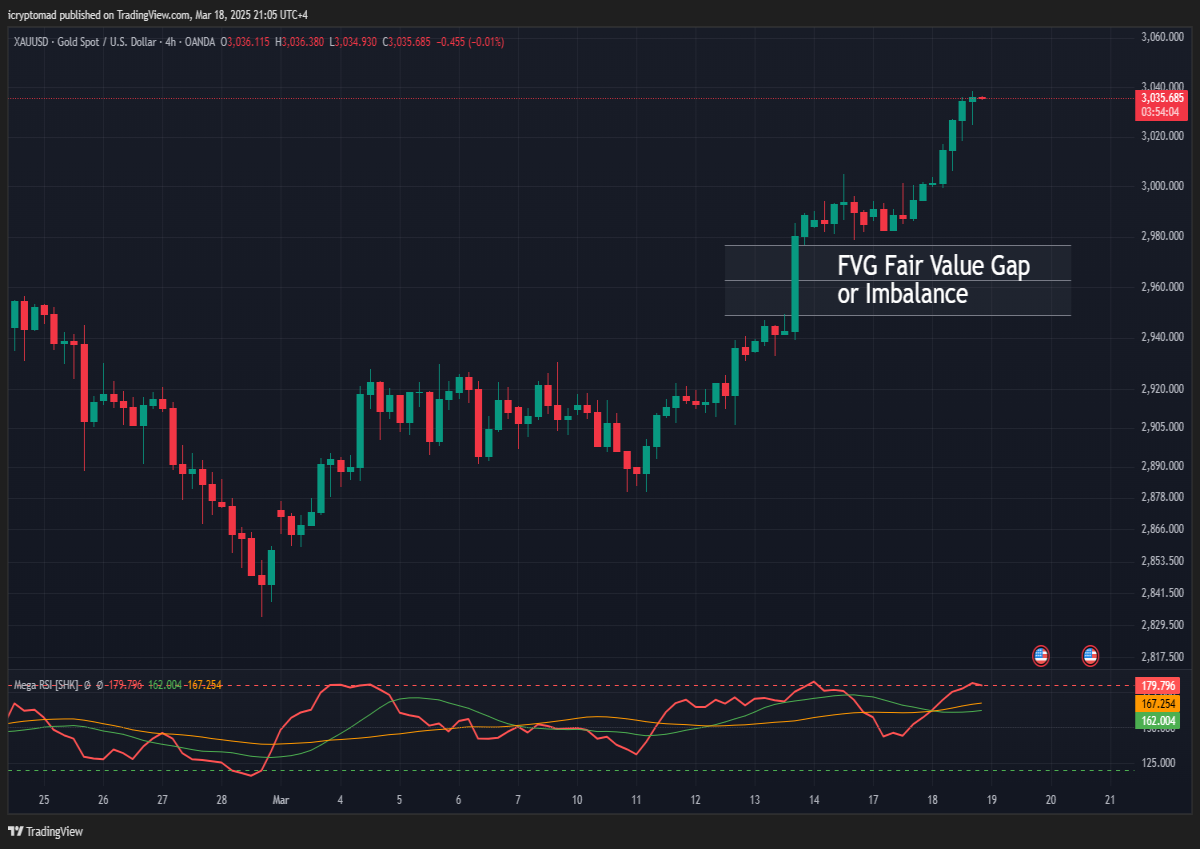
Imbalances, are those sharp rises or falls (FVGs, or Fair Value Gaps), often highlight areas where price hasn't fully consolidated, and traders might expect the market to revisit those zones.
see this for better understanding of FVG or Imbalances:
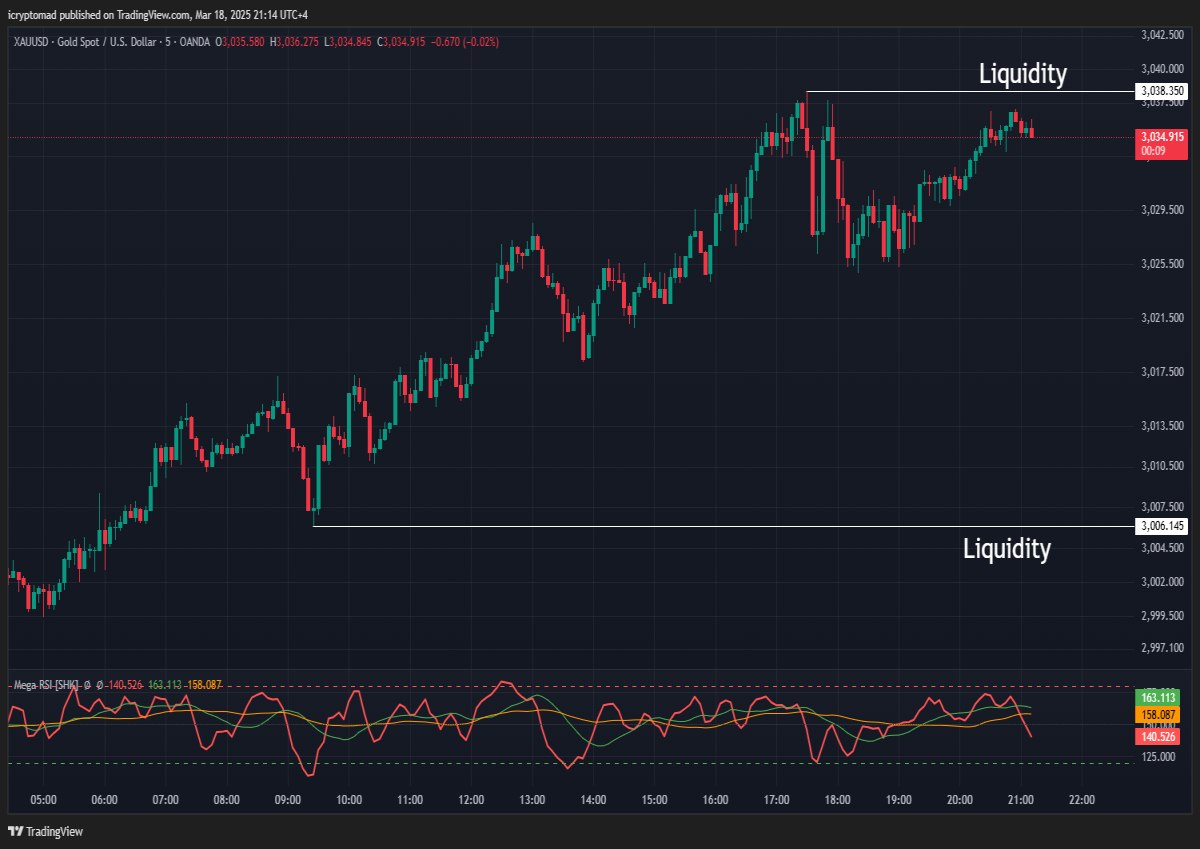
Liquidity levels, represented by the extremes of highs and lows, can act like magnets for price as they tend to attract stop-loss orders and other pending orders from traders.
see this for Liq. levels:
I have this idea that imbalances and liquidity levels are the most important in trading. I define imbalances the sharp rise and fall FVGs and liquidity levels are simply the shadows and picks of highs and lows.
Now Imagine the current Gold chart which I sent in two different timeframes above, so I believe tomorrow the highest shadow will attract the traders to go and hunt the stop loss of short positions. but then, there are many imbalances below because of the latest rise.
The idea of the highest shadow being a target for stop-loss hunting is insightful. Often, price movements gravitate towards these liquidity-rich zones before reversing. At the same time, the imbalances left behind during the rapid rise in gold could signal a potential corrective move downward—markets often seek to "fill the gap" to restore equilibrium.
Liquidity levels in trading are key areas on a price chart where there is a significant concentration of buy or sell orders. These levels often act as magnets for price movements because they represent zones of high trading activity or pending orders. Here's a breakdown:
-
Types of Liquidity:
-
Buy-Side Liquidity (BSL): Found at levels where short sellers place their stop-loss orders, typically above recent highs. When price reaches these levels, it triggers buy orders, often leading to upward price movement. like ATH of Gold right now.
-
Sell-Side Liquidity (SSL): Found at levels where long traders place their stop-loss orders, usually below recent lows. When price hits these levels, it triggers sell orders, often causing downward price movement.
-
-
Why Liquidity Levels Matter:
-
Stop-Loss Hunts: Large market participants, like institutions, often target these levels to trigger stop-loss orders and create the liquidity they need to enter or exit positions.
-
Reversals and Breakouts: Liquidity levels can act as zones where price reverses or breaks out, depending on the market's reaction to the orders triggered at these levels.
-
-
How to Identify Liquidity Levels:
-
Look for swing highs and lows, as these are common areas for stop-loss orders.
-
Mark previous day/week/month highs and lows, as they often serve as key reference points for traders.
-
Observe consolidation zones, where price has previously stalled, as these can indicate areas of high liquidity.
-
-
Trading Strategies Around Liquidity:
-
Liquidity Sweeps: When price moves through a liquidity level to trigger orders and then reverses direction, it can signal a potential trade setup.
-
Confluence with Other Indicators: Combining liquidity levels with support/resistance, trendlines, or volume analysis can improve the accuracy of your trades.
-
Understanding liquidity levels can give us an edge in anticipating price movements and identifying high-probability trade setups.
FVGs also are fascinating in trade, but I let it be another topic in detail. not to make this post so long. let's see how Gold reacts to those Liq levels and imbalances in the given charts :)


