An Elliott wave approach to analyze Ethereum 1h chart

An Elliott wave approach to analyze Ethereum 1h chart

By Emad | honarparvar | 28 Jul 2022


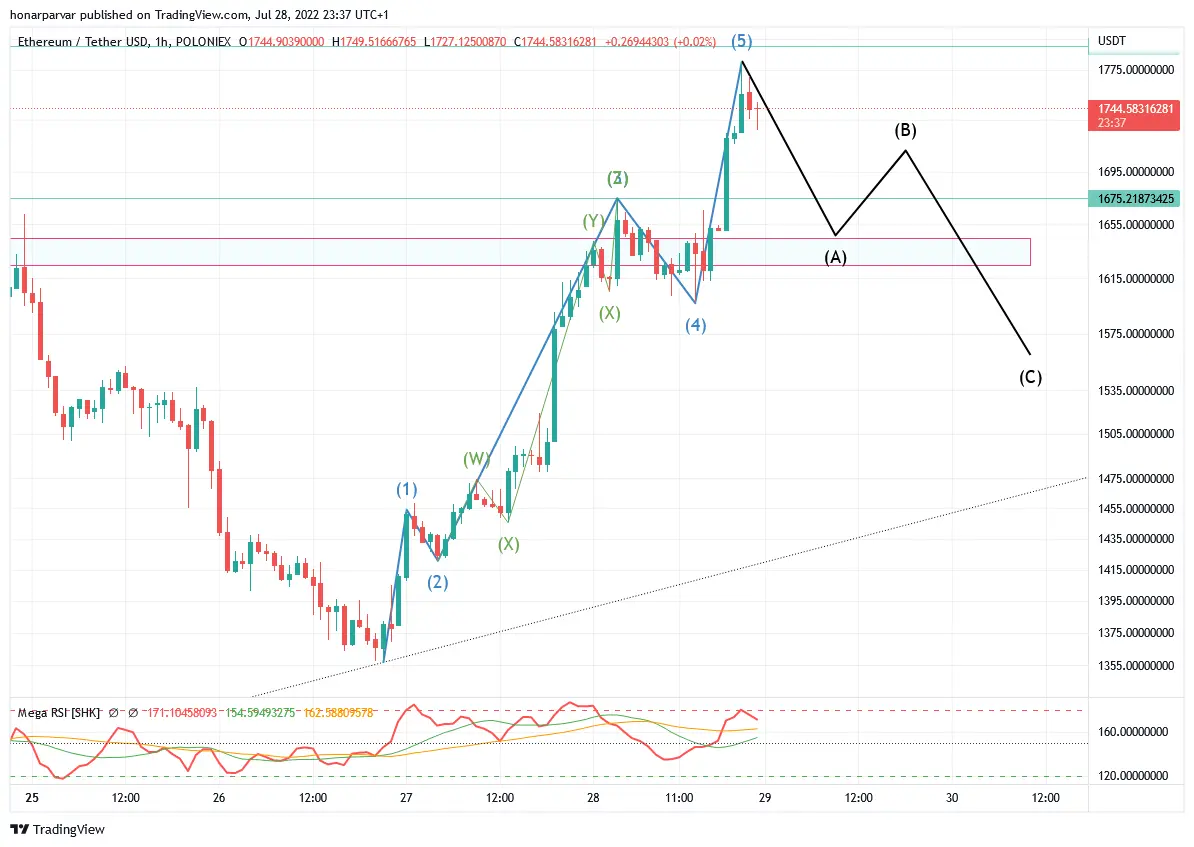
let's consider the beginning and source of the current move, the lowest level of July 26th;

Elliott impulse wave 12345 leads us to the recent high;
the 3rd wave itself can be shown as a WXYXZ combo wave;
divergence is probable (highly) in 1h time frame and if it gets confirmation, next move can be the ABC correction waves.

A ends up around the supply zone and C ends up 50% correction of the 12345 wave.
a68008207e16ad866270ef81c664a725288836b4fa7e5cdd481a41e862e6cf6d.png

you can play the chart to see how things went on since then here:

https://www.tradingview.com/chart/ETHUSDT/KshC9uxD-An-Elliott-wave-approach-to-analyze-Ethereum-1h-chart/


How do you rate this article?

21


Emad
Emad

youtuber, business developer and Crypto enthusiast


honarparvar
honarparvar

Writing is my addiction!

Publish0x

Send a $0.01 microtip in crypto to the author, and earn yourself as you read!

20% to author / 80% to me.
We pay the tips from our rewards pool.


