Bitcoin future CME & Bitcoin spot analysis
Hello, today a little analysis of Bitcoin future.
I want to tell you that I do not have a crystal ball this is a simple observation.
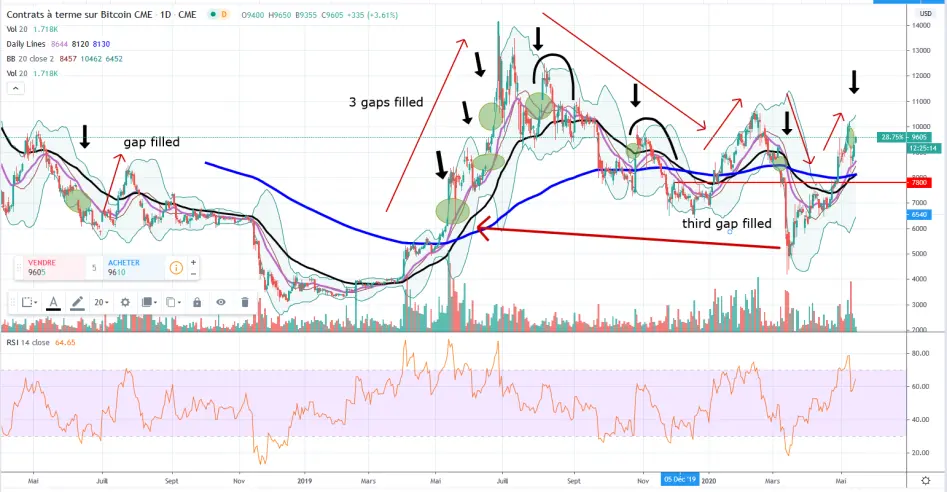
The small green circles are the gaps on the CME, each gap is doomed to be filled with candles on the contrary. We notice that it works well, the first gap was filled very quickly.
Thereafter, there are 3 gaps which are filled on the descent. In the descent, there were two open gaps which filled immediately. The third gap was filled in the fall of March with the covid 19 On the current rise we have filled the gap of the fall of March.
Last week, we had a gap when we went from $ 10,000 to $ 8,800, this gap is currently being filled.
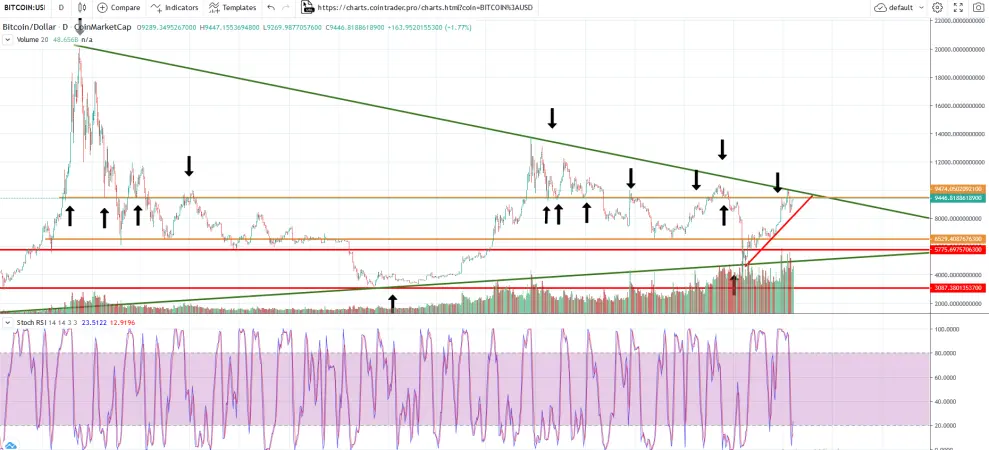
On the following graph, with the Bitcoin spot we arrive at a resistance zone marked in yellow. In addition above, there is a green oblique which passes on all the highest peaks of late 2017, 2019 and currently 2020.
My wish will be to break the oblique, but I can't help but notice these levels which have resisted in the past. Take some of your profits (like 10% to 15%) will not be absurd on these levels but the bearish signal will be given to the breaking of the red line.