
Bitcoin is trading near $66,000. Price looks “stable” to most traders.
But volume participation tells a different story.
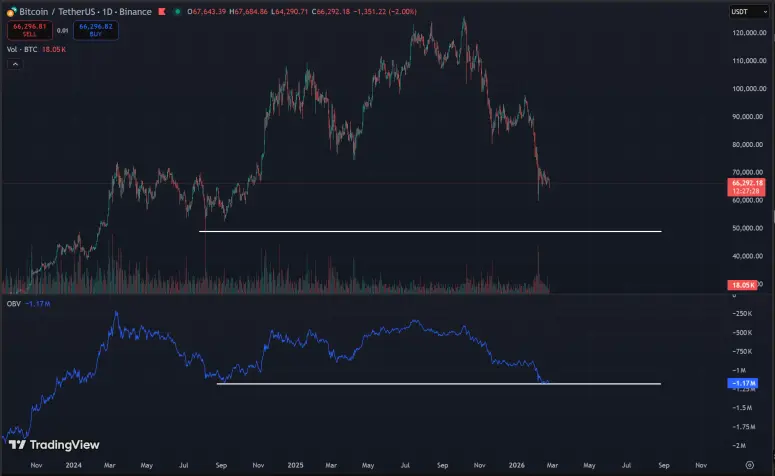
On the daily chart, OBV (On-Balance Volume) is pressing toward a major structural breakdown level — a level that previously existed when BTC traded closer to the $49K zone.
That mismatch is not a small detail.
It’s often what appears before liquidity-driven downside expansions.
1) What the Chart Actually Shows (Daily)
Observation A — Price is elevated: BTC holds ~$66K after a sharp rejection.
Observation B — OBV is collapsing: OBV is approaching the prior floor.
This is a classic price vs participation divergence:
-
Price can hold because liquidity and positioning support it temporarily
-
But OBV shows net distribution underneath
If OBV breaks its prior structural low while price remains elevated, it implies that real selling pressure is absorbing bids even though price has not fully repriced yet.
2) Why the $77K–$79K Rejection Matters
The $77K–$79K area was not “just a resistance.”
It was a liquidity magnet zone:
-
breakout longs pile in
-
stops sit below key structure
-
liquidity accumulates around the high
The failure to hold that zone suggests that liquidity was taken — but continuation failed.
3) Why OBV Breakdown = “Hidden Distribution”
OBV doesn’t predict. It confirms.
When OBV trends down while price holds, it usually means:
-
buying is not real expansion buying
-
selling is being executed into liquidity
-
price stability is “supported” temporarily
In plain words:
price looks okay, but capital is leaving.
That is exactly how many bull traps are built.
4) The Leverage Problem: Why This Can Cascade
After rejecting $77K–$79K, many longs are now sitting with pressure:
-
late longs entered high
-
liquidation levels tighten as price drifts down
-
any sharp push lower can trigger forced selling
That forced selling can become a chain reaction, especially if liquidity sits below current range lows.
This is where markets “accelerate” downward — not because everyone suddenly becomes bearish, but because positions become mechanically forced out.
5) What Would Confirm a Bull Trap Setup (and what would invalidate it)
Bull trap confirmation signals
-
OBV breaks the prior daily low (new OBV “floor break”)
-
price holds short-term but keeps making lower structures
-
volatility expands downward after “quiet stability”
Invalidation signals
-
OBV recovers strongly + breaks back above the breakdown zone
-
BTC reclaims $77K–$79K with sustained volume confirmation
-
downside sweep reverses aggressively (true absorption + impulse)
Until invalidation happens, the risk remains asymmetric.
6) Risk: What a Professional Response Looks Like Here
This is not the place to “hope.”
It’s the place to structure exposure.
Professional risk response typically means:
-
avoid high leverage
-
reduce position size
-
respect volatility expansion zones
-
treat the current range as fragile until volume confirms strength
Closing
Bitcoin holding $66K can look bullish — until you read participation.
OBV nearing a structural breakdown while price stays elevated is a classic distribution warning.
If liquidity builds below current structure and leverage remains pressured, downside expansion becomes structurally “easy”.
Price is what people stare at.
Volume is what the market tells you.





