
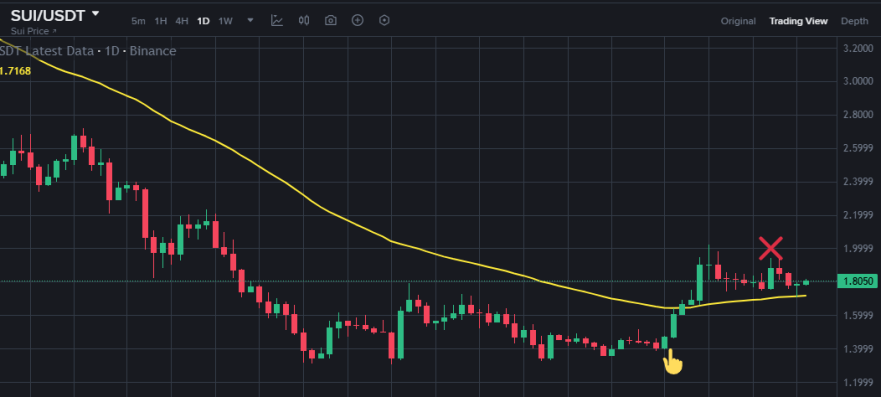
This is the real 1 day chart of SUI/USDT on 17-january 2026
Timeframe used = 1 day only, strictly no other because 1 week is slow and 4 hr is unpredictable
Indicator used=EMA 50 yellow line only , strictly no other indicator because more lines create confusion, not clarity
target =take a buy/long swing trade with 5 to 10 % profit in mind
Timings: From entry to exit, approximately 2 to 3 days
Best working environment=when a downtrend reversal to an uptrend
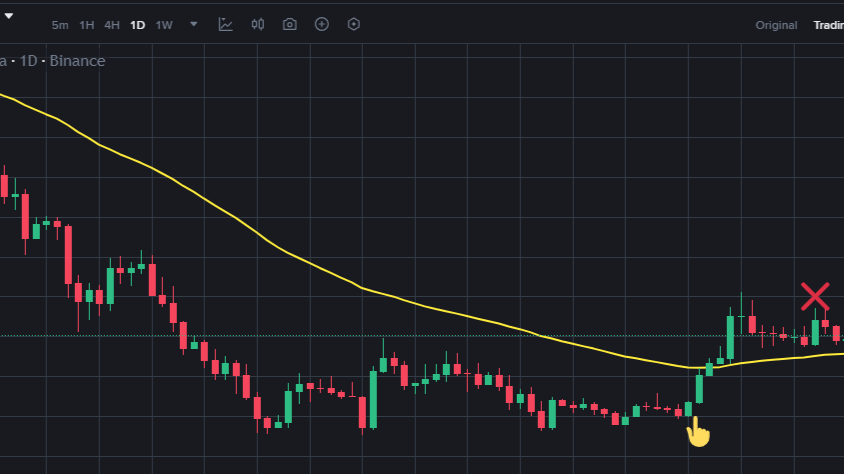
- Step1=on Binance mobile app, search for coins one by one. The coin for the yellow line's recent part is in a good upward angle, not flat or down
- This shows an uptrend confirmation because the uptrend is, in a 1-day chart EMA 50 line's recent part in an uptrend, remember that
- step2=wait for price breakout at the yellow hand, but do not enter in fomo
- step3=wait for price pullbacks to the yellow line and again bounce up
- Golden tip: at a red cross, do not enter because it's a trap of big players to eat your stop loss
- step4=most prababilly you will see that price again goes down, then goes up with a bullish green candle like a pin bar
- step5 = it's your moment to enter, which means the third time going up, making a W-like pattern
Risk management=preset take profit=+5% and stop loss=-10%
Golden tip: do not set stop loss at -2% or -5% because in the crypto market, price fluctuates to a higher ratio in comparison to other markets. This is the main reason why most of the time your stop loss have become hit, and loss occurs
JUICE: When noise confuses the crowd, this simple strategy gives you the clarity and path to consistent profit. I mean to say that profit is hidden in simple strategies, not in complex so many lines