
Data from Bloomberg and the analytical company Duality Research show the overall growth of the S&P 500 index - yet it does not reflect the performance of most of its components. Since the beginning of the year only 33% of the stocks within the S&P 500 have delivered returns higher than the index itself, meaning the remaining 67% are lagging behind the average and the market growth is driven solely by large issuers. T
o better understand how the S&P 500 is calculated it is worth noting that the larger a company's market value, the stronger its impact on the overall index performance. While the mega-cap companies grow, most ordinary stocks are stagnating or even showing a negative trend - and such a trend is a warning sign for an investor. If that 33% group of giants suddenly drops or falls, the other 67% will go down right after them - I will add from myself that this is a forecast which does not follow directly from this data.
Analyzing the internal structure of the sectors shows which industries are truly resilient and which depend to some extent on just a few players.
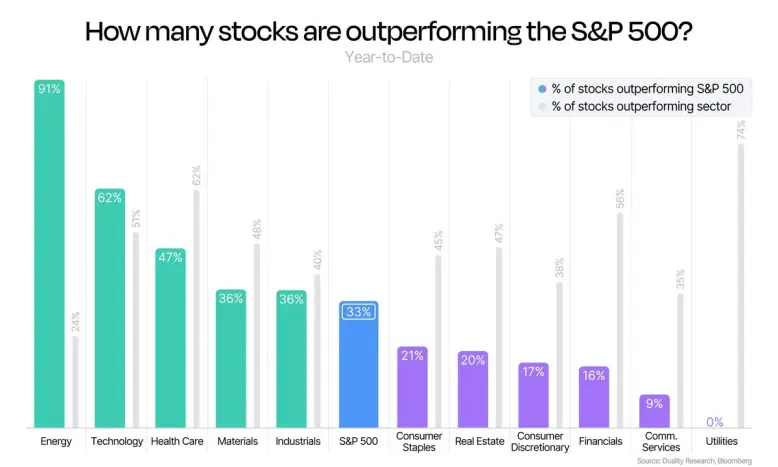
The energy sector showed the highest level of growth - 91% of companies in this sector outperformed the broader S&P 500 market, but at the same time only 24% were able to beat the average of the energy sector itself. This suggests that capital was distributed evenly across the entire sector rather than being concentrated in just one or two giant companies.
In the technology sector everything remains stable - 62% of companies outperform the broad market, while 51% of stocks beat the average return of their own sector. This indicates that the overall upward trend is supported by most technology enterprises.
In the financial sector however only 16% of companies outperform the S&P 500, yet 56% outperform the internal sector benchmark. This data indicates that more than half of the components beat the sector average even though the sector as a whole lags behind the broad market.
The situation with Utilities is even more interesting - here the sector showed 0% of companies outperforming the S&P 500, but 74% of stocks beat their own sector average. This shows that the industry is experiencing macroeconomic pressure overall but individual companies are demonstrating better dynamics than the industry average.
In short, to summarize everything in a few sentences, the 33% figure means that the S&P 500 gains belong to a narrow group while the other 67% lag behind the index result itself. Energy made a strong impression - the fact that 91% of companies in this sector outperformed the S&P 500 indicates that not only mega-caps play a role here. Meanwhile the utilities sector demonstrates uneven results within the industry with 74% of stocks beating the sector average - meaning that even in a weak sector, individual companies can demonstrate better performance than the industry as a whole.
Thank you for reading/






