
To be able to make an investment on a cryptocurrency or simply understand it better, it is important to understand what it offers but also to understand its price history to better anticipate its reactions.
Today we will do work together. Together? Yes, I will make you work a little in this article. We will start by analyzing the prices since the launch of Ethereum. Try to divide the chart below into 3 zones. Here we go!
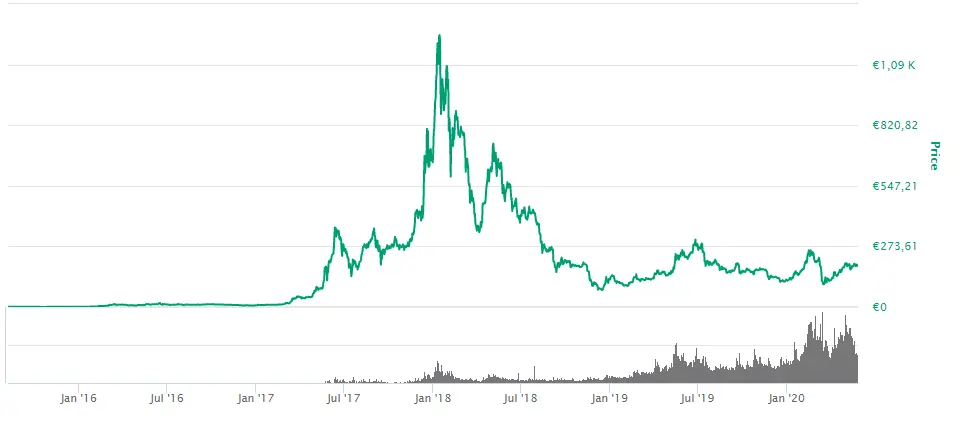
Have you tried? Let’s compare your segmentation with mine. I will explain my segmentation later. Here’s how I chose to divide the ETH price curve.
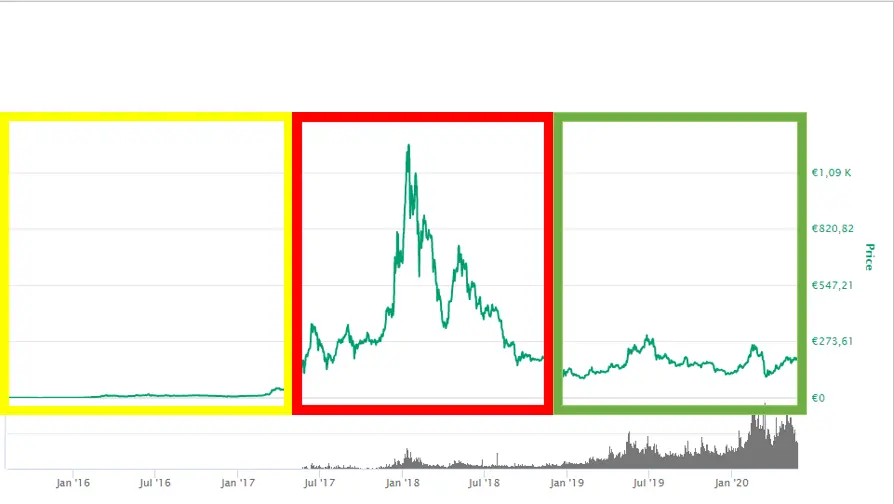
Have you arrived at something similar? We can distinguish 3 areas:
- Yellow: launch/slow growth zone
- In red: zone of bubble/high volatility
- Green: an area of early maturity
The yellow zone corresponds to a launch zone which is growing very slowly but stable. At that time, even though the Ethereum was already famous, it was little possessed and used. Thereafter, the entire world of cryptocurrencies experienced a sharp increase that was however disconnected from the real value. The fluctuations in values are then enormous. This phase is represented by the red segment. However these strong price variations have calmed down. Today the Ethereum has much more stable prices (green zone). This price stabilization is accompanied by an increase in daily volumes. This increase is generally constant.
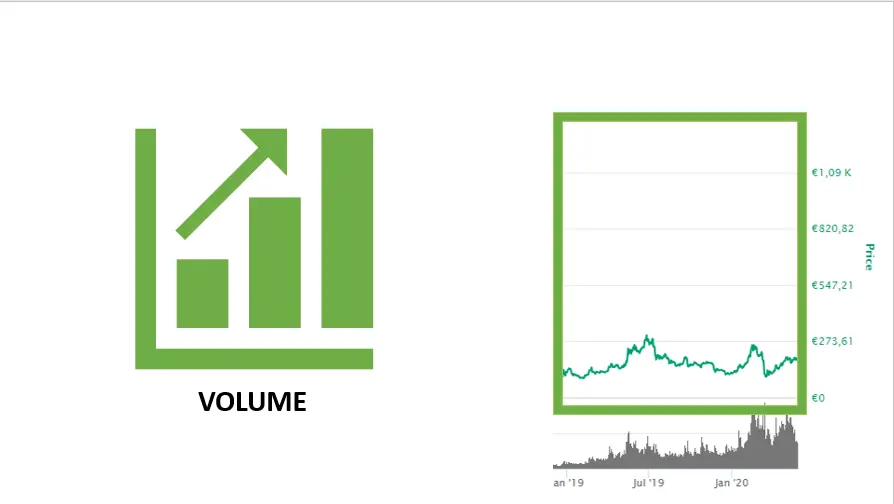
In this area, it is interesting to look at the crisis linked to Covid-19 because this crisis gives us a model of price collapse that will be very useful to us in the event of a future crisis. We can see that this has led to lower volumes and lower prices.
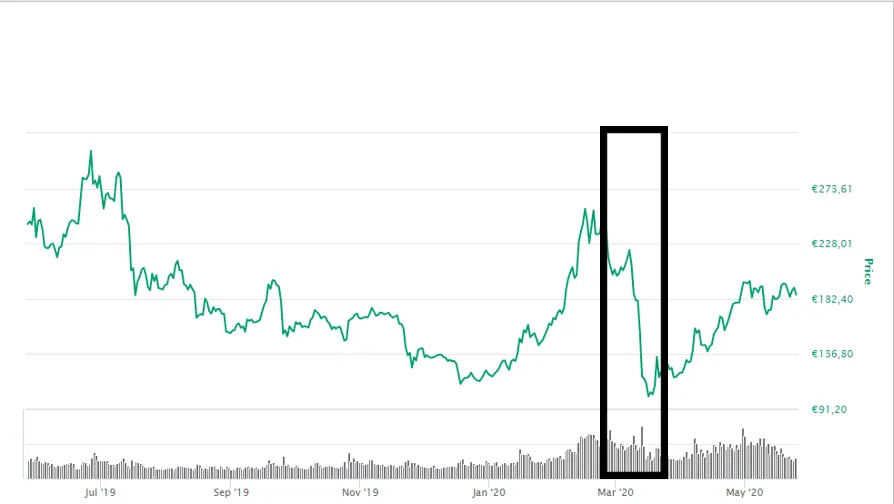
Obviously if the Ethereum costs around 100€ ($110) it creates a purchase movement. Conversely, if the Ethereum costs more than €250 ($275), the number of sellers increases strongly and buyers are more shy.
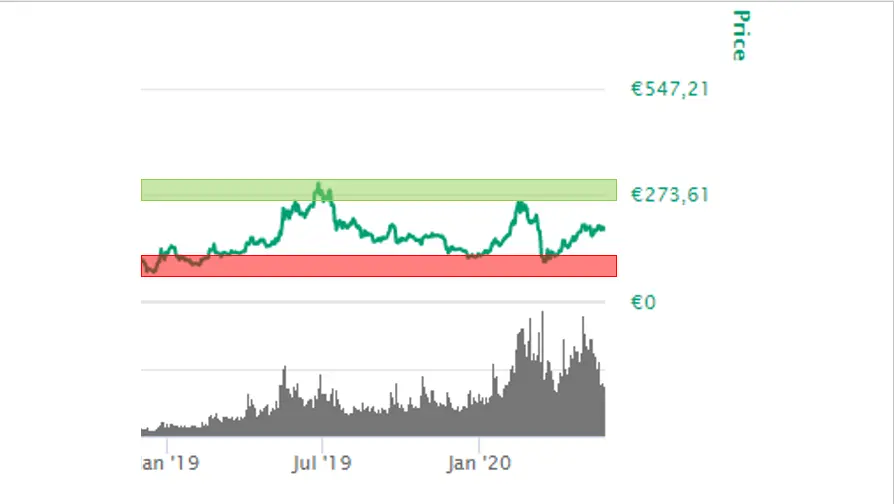
It is therefore in this price gap that the Ethereum seems to be evolving for more than a year. We can deduce another more precise channel (in grey on the following image) which more precisely encompasses most of the price of this cryptocurrency. The prices are between 160€ ($175) and 200€ ($219.5).
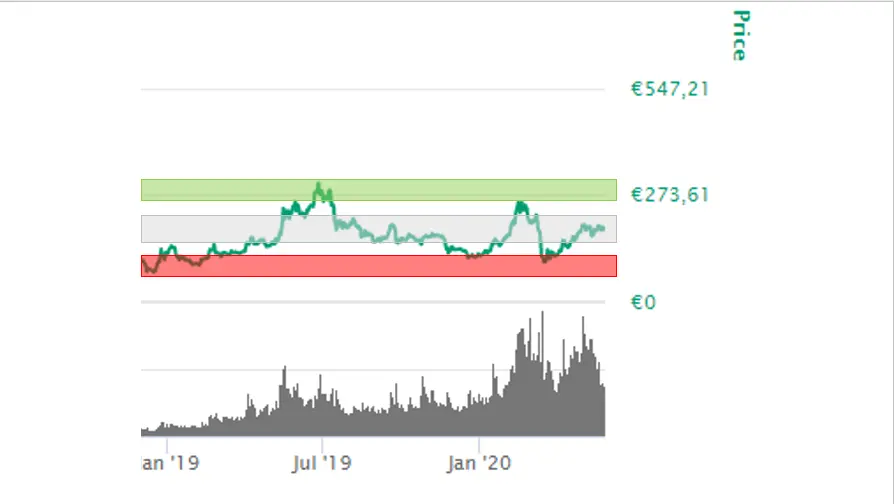
I hope now that you understand better the evolution of the Ethereum prices and that you will be able to more easily make your projections in case you want to invest in this currency. If that is what you want to do, I invite you to find out more before embarking on this adventure.
For more articles and analysis of all kinds, subscribe!





