
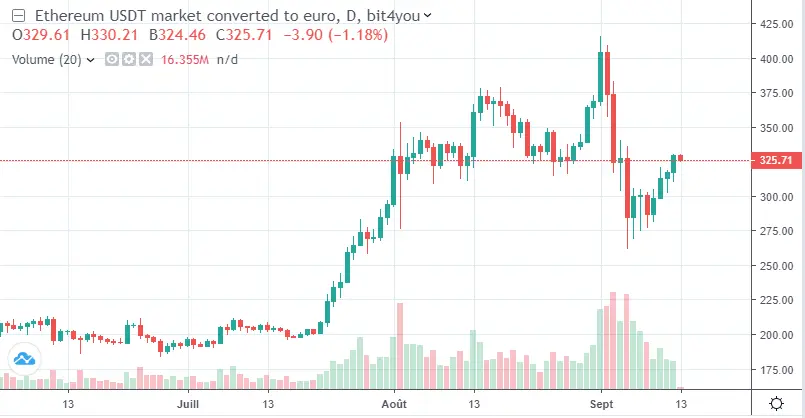
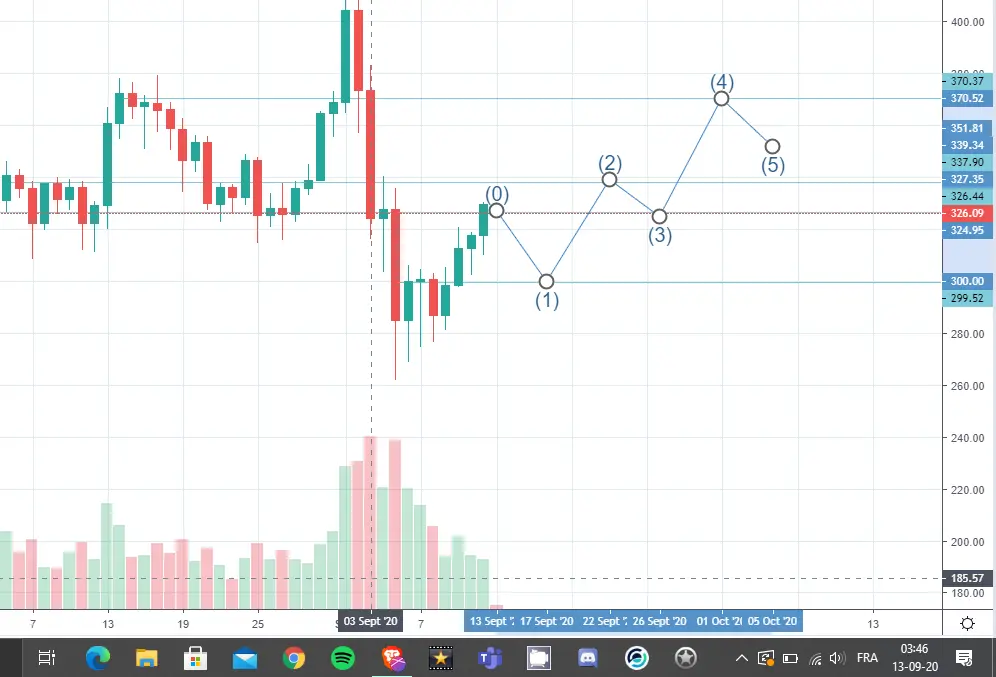
ETH is at a key point in graphical terms. It comes around 325€. It is around this area that the support and resistance zone of the last month seems to be established. Let’s take a look at the recent evolution of the ETH to understand what’s going on.
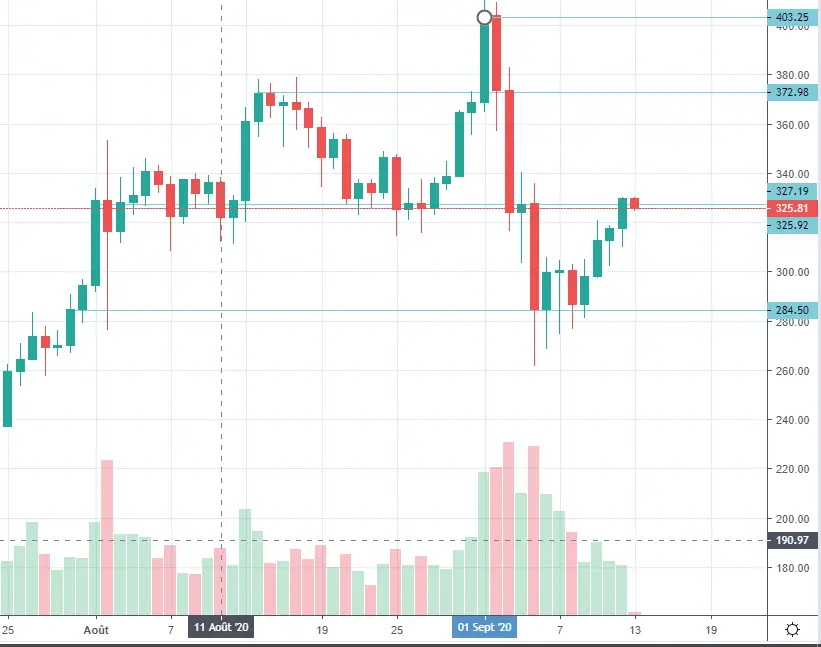
Different price levels are important. The €284 area that stimulates buying from investors. When prices go down in this area, it seems that everyone is buying. The zone of 325€ - 327€ which is a zone of delay. In this zone the prices stabilize. The slightest positive or negative signal automatically starts a rise or a fall. The area of 372€. Very high level of the ETH which seems to push investors to sell. So this is a resistance zone. 403€, this is the record peak of the ETH. However, prices do not appear to be ready for stabilization at this high level.
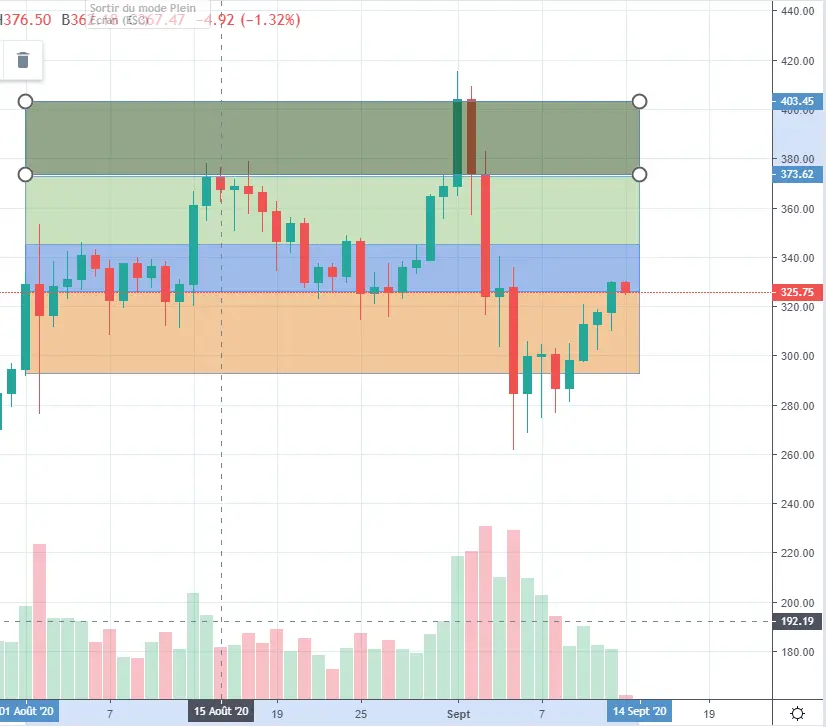
What conclusions can we draw from this? Orange zone: Buy! Blue zone: Wait! Light green zone: Sell! Dark green zone: I told you to sell!
What scenarios should we consider?
1) Sunset: this is a very likely scenario. In this scenario, the prices have for resistance zone 325€, they are established in a support zone around 286€. The channel that is emerging will therefore evolve in this price range.
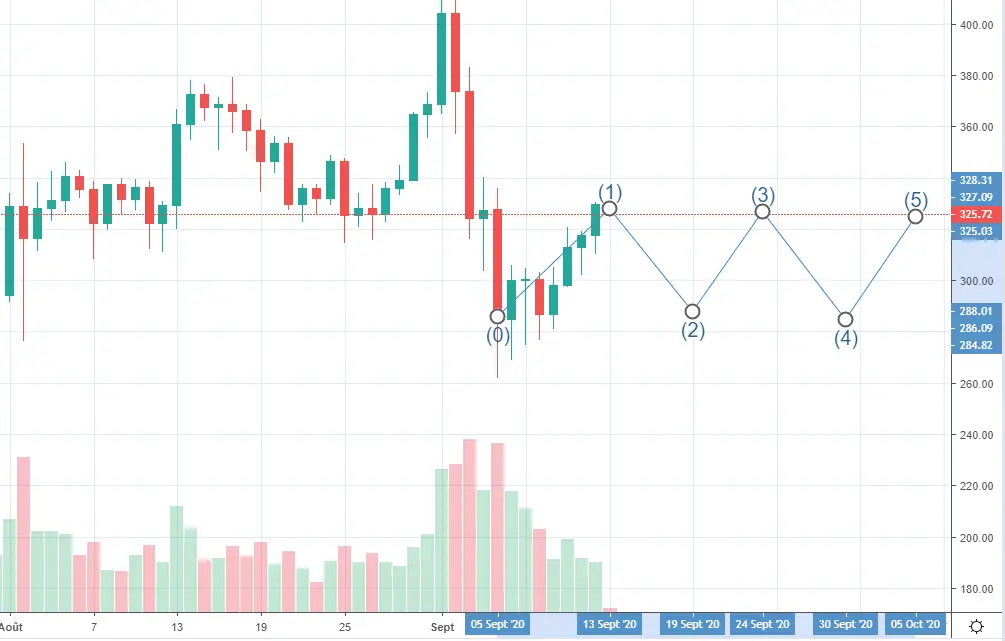
2) Slow Rise: This is also a very likely scenario. It is possible that this increase is punctuated by small price declines. Gradually, the areas of support and resistance will translate vertically upwards. This hypothesis will only be possible if ETH does not suffer bad news concerning the development of ETH 2.0.
3) Crash or rather strong bearish movement. A scenario that would only be possible if ETH received a large amount of negative news.
4) The jump. This scenario would only be possible if ETH received a large amount of positive news. For scenario 3 and 4, I do not make any graphic projections because these movements could be very strong and are difficult to quantify.
I hope this article can shed some light on that.





