
Call me crazy but I get more excited when markets go down then I do when they go up as it provides long-term investors with the opportunity to lower their cost basis. The trick of course is knowing when to buy as catching a falling knife is never fun. As many of you have read prior posts where I introduce the StratVal concept, I thought I'd run it on a dozen of the top coins, along with how far they have fallen from their all time highs. The charts below rank according to drawdown and also give the corresponding StratVal reading. Of note, this is done using closing daily data so intra-day drawdowns are likely to be much larger. Read below charts for more intel.


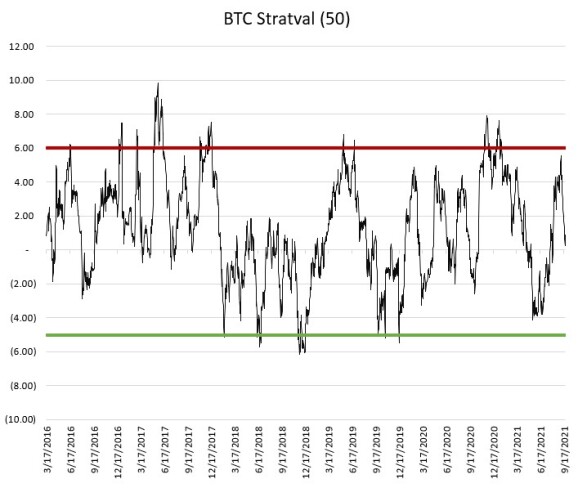
For those who have not been following the StratVal posts, it compares an assets risk adjusted performance relative to its own history. I especially like this oscillator for crypto as it incorporates risk as well. The best way to think of this is as a red-engine light coming on in your car because the engine is about to overheat. It doesn't tell you when or necessarily guarantee it, but it does tell you things are getting quite extended relative to history. Conversely, when StratVal readings are low (-5'sh) it may indicate that things are about to either stabilize or bounce. I'm only pasting the BTC drawdown and Stratval charts but you can see the reading for each coin on the tables.
To help calibrate: AVAX has held up reasonably well but still has a check engine light on. DOGE has gotten hammered the hardest in terms of drawdowns. Most of the StratVal readings are now in the central range with really nothing coming up as oversold yet. Because of that, I'm staying on the sidelines for the time being as I prefer to come in when the StratVal levels are much lower.
As always, this is not investment advice so please do your own research. Hope this is informative.
Cheers,
NZFX
PS-In constructing my analysis, I use data sources I believe to be accurate but can make no guarantees as to their (or my) accuracy.


