
Bull run continuation or dead cat dance : it seems there is no doubt anymore. It is going to be the bull run continuation. It is probably a matter of days before BTC crosses its ATH.
So now the next question is : what is going to be the top of this bull run and when is it going to be ?
Well, I haven’t got the answer but I tried to figure out what the prediction could be.
For that, I had a look at the PlanB chart comparing 2012, 2016 and 2021 cycles. Of course, what follows is based on the assumption that we can compare the cycles and that we are not in a « this cycle is different » situation.
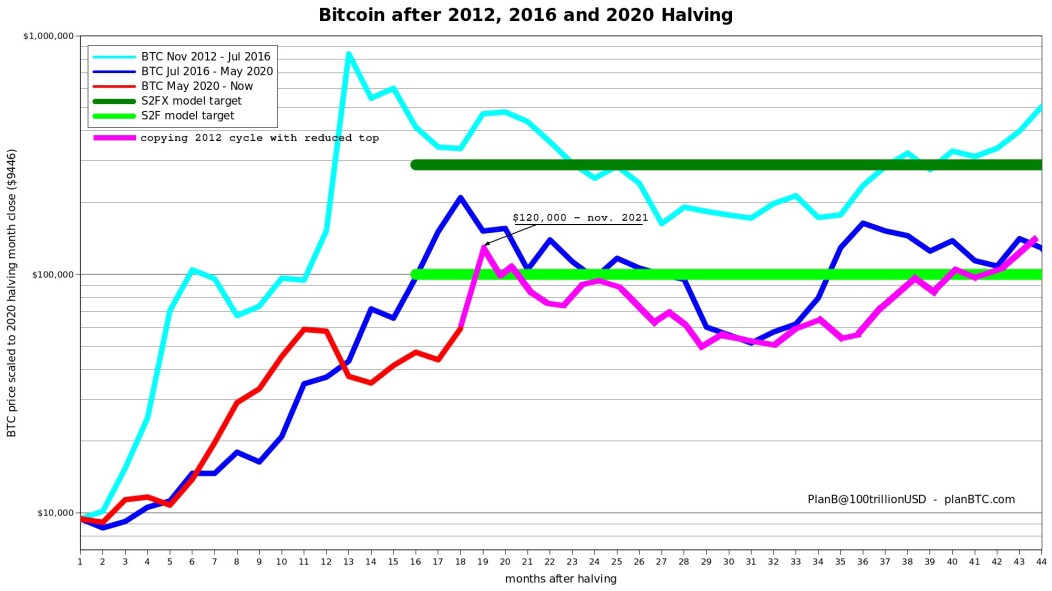
Just have a look at the chart : red curve is this cycle when the sky blue curve is the 2012 cycle (dark blue being the 2016 cycle). We see clearly that the red curve and the start of the sky blue curve are very comparable. So I tried to copy the 2012 cycle curve as a follow on to the red curve but with the assumption that the top is going to be lower than the previous cycle (as 2016 top was lower than 2012 top). I draw the pink curve to try to extrapolate the 2020 cycle.
This is a rough attempt of course but let’s say it is not that stupid. Then I end up with a top in november at the $120,000 mark.
Having a BTC at $120,000 is a good news but having it in november requires to already prepare for the bear market ...
Hope this time I am right (this was not the case in my last article based on the same graph …). See my last post "bull run continuation or dead cat bounce ?".


