
The global financial ecosystem is showing deep structural cracks, and the epicenter isn't Wall Street it's Tokyo. A massive wave of liquidations recently hit the markets, highlighted by data circulating on financial social media showing a breathtaking MASSIVE DUMP where $700 billion vanished from US equities in less than an hour. To put this into perspective, Elon Musk's SpaceX alone saw $250 billion erased from its valuation during this chaotic window.

What triggered this sudden collapse? The answer lies in the aggressive unwinding of the Yen Carry Trade. For years, institutional funds and macro investors borrowed Japanese Yen at near zero interest rates to fund high yielding investments in US stocks and digital assets. However, with heavy rumors that the Bank of Japan (BOJ) is actively intervening to defend its currency, the rules of the game have flipped. To cover their suddenly expensive Yen loans, global funds are forced to liquidate their premium assets, sparking a domino effect across traditional and crypto markets alike.
A Historic 36 Year Breakout
From a purely technical perspective, the USD/JPY pair is doing something it hasn't done in decades. When we look at the macro picture through the lens of a 3 Month (3M) time frame, the current price action is nothing short of historic.
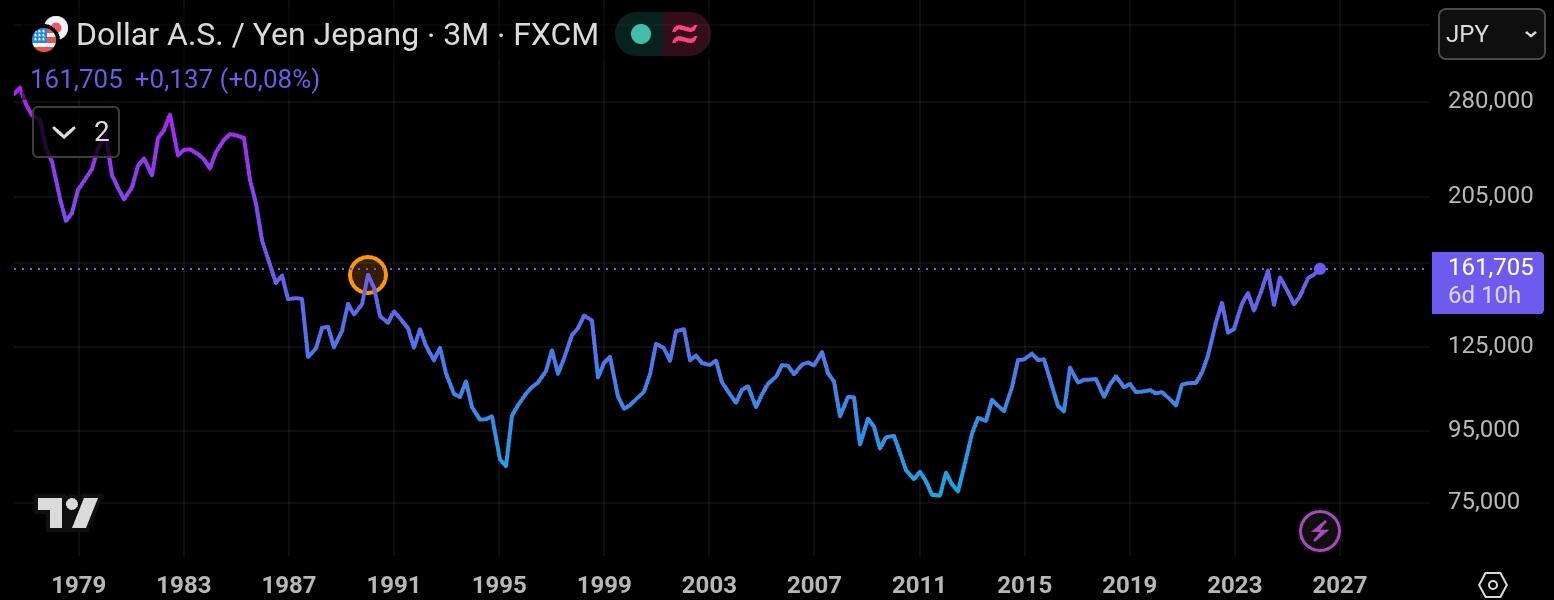
The orange circle on the chart marks a critical resistance level established all the way back in 1990. For 36 long years, the Japanese Yen fought to keep the US Dollar below this ceiling. Today, that barrier has been shattered as USD/JPY cleanly cleared the 161.705 level. This confirms a multi decade bullish breakout, showing the US Dollar trading at its highest valuation against the Yen since the 1986 - 1990 era.
To gauge whether this historic run is sustainable or due for a breather, we can look at the immediate momentum using a cluster of highly reliable technical indicators.
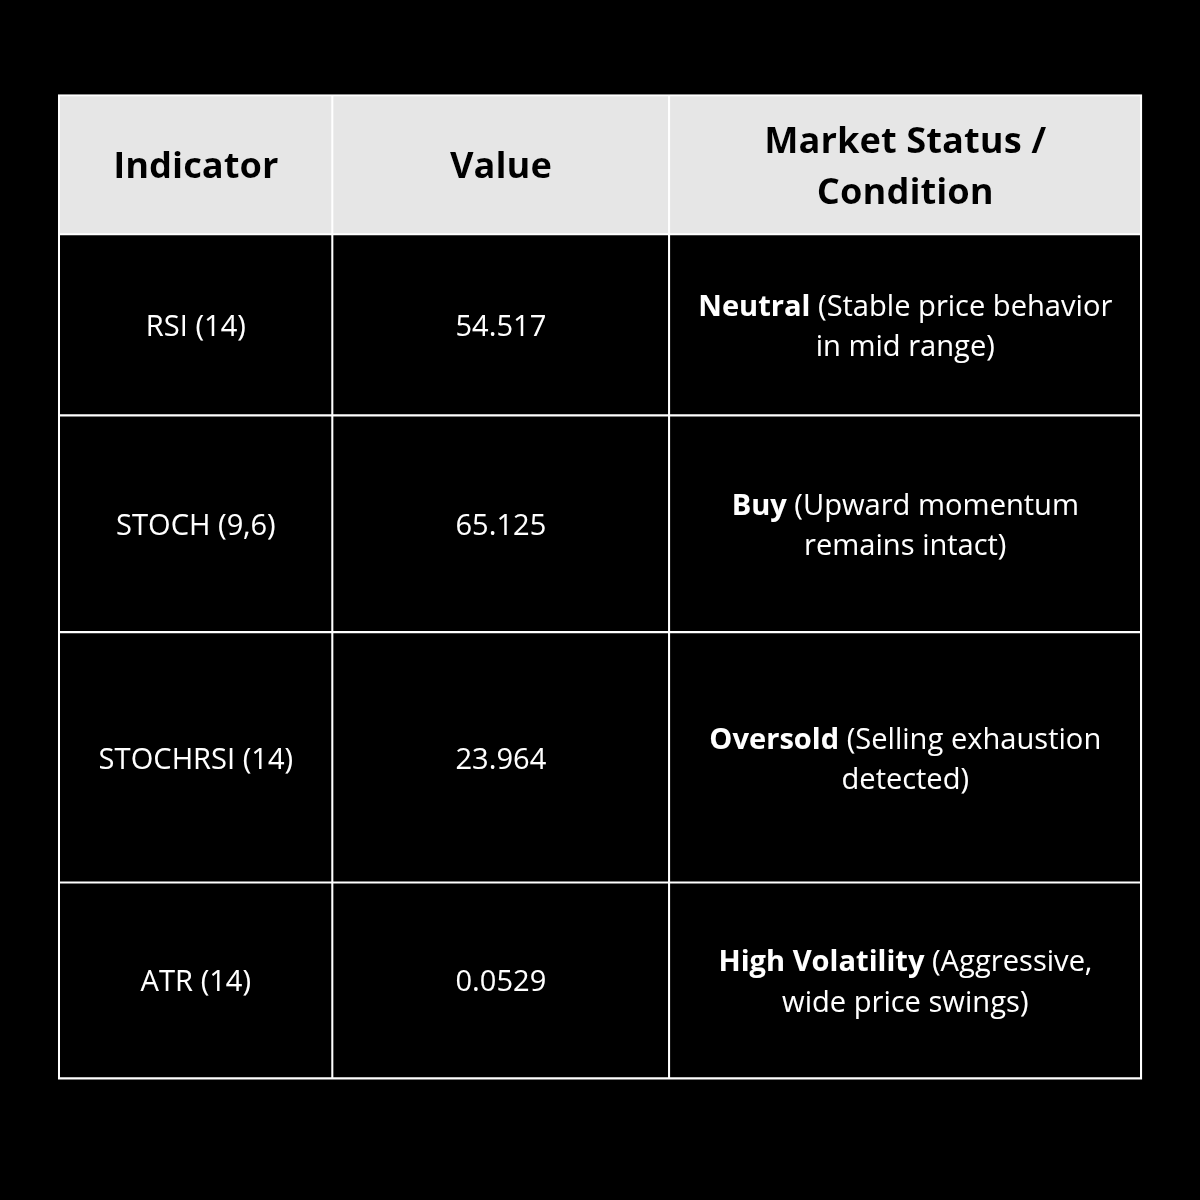
Note: The divergence between these metrics presents a highly lucrative setup. While the standard RSI points to a neutral consolidation, the Stochastic RSI signals that short term selling pressure is deeply oversold. Paired with a high Average True Range (ATR) value, it indicates that the current downward pressure is hitting exhaustion, clearing the path for an aggressive relief bounce.
However, trading this macro environment requires navigating sudden policy shifts. On the Daily (1D) chart, the footprints of previous BOJ interventions show just how brutal the corrections can be.
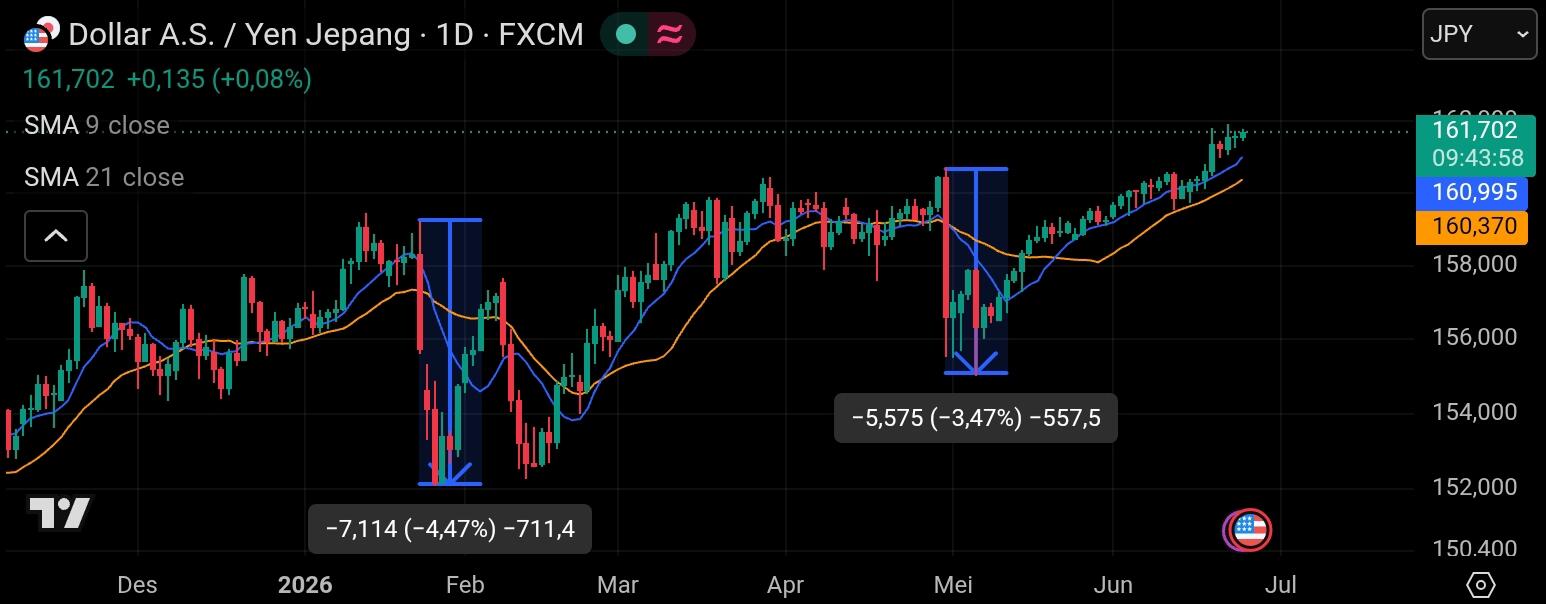
Historical data reveals that sudden central bank liquidity drops forced the market down by -7,114 pips (-4,47%) in February, followed by another sharp drop of -5,575 pips (-3,47%) in May.
While these sudden drops can wipe out overleveraged retail traders, the broader structural trend remains firmly protected on the Weekly (1W) time frame.
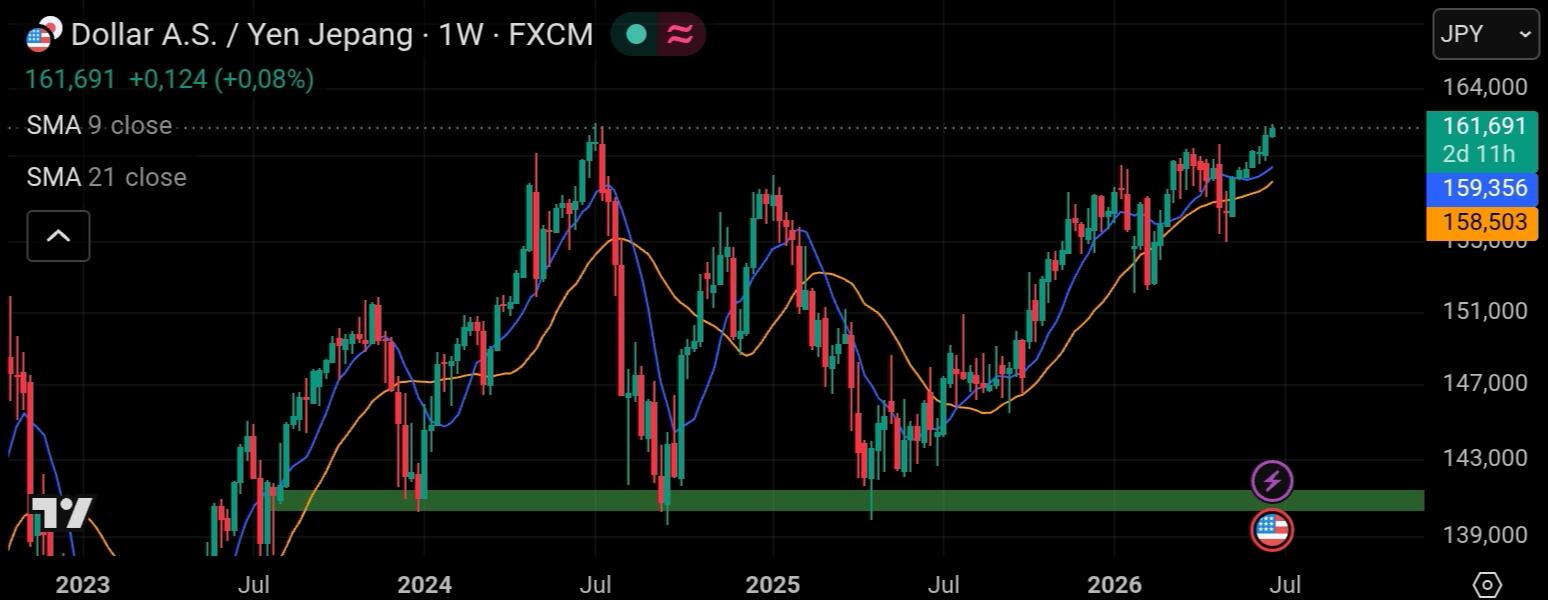
The giant macro uptrend is backed by a massive historical defense line. The major support located at the 141.500 - 140.212 zone stands as the strongest fortress for structural buyers. As long as the price action stays comfortably above this green horizontal belt, the macro bias remains heavily tilted toward the bulls.
My Opinion
This sudden global market correction is a harsh reminder of how deeply connected the foreign exchange market is to global equities and high risk digital assets. In my opinion, while unexpected interventions from the Bank of Japan can cause panic and trigger sudden, multi hundred pip drops, they do not possess the structural power to reverse a primary macro trend that has been printing for over thirty years.
The clear oversold readings on daily momentum oscillators, combined with the impenetrable structural floor between 141.500 and 140.212, present a highly calculated opportunity. Ultimately, steep corrections driven by central bank interventions shouldn't be feared as market crashes instead, they should be viewed as premier institutional discount windows to catch optimal long entries aligned with the dominant macro trend.
Click here to read my authentic and original analysis
Sources